Indexed In
- Open J Gate
- Genamics JournalSeek
- Academic Keys
- JournalTOCs
- The Global Impact Factor (GIF)
- China National Knowledge Infrastructure (CNKI)
- Ulrich's Periodicals Directory
- RefSeek
- Hamdard University
- EBSCO A-Z
- OCLC- WorldCat
- Publons
- Geneva Foundation for Medical Education and Research
- Euro Pub
- Google Scholar
Useful Links
Share This Page
Journal Flyer

Open Access Journals
- Agri and Aquaculture
- Biochemistry
- Bioinformatics & Systems Biology
- Business & Management
- Chemistry
- Clinical Sciences
- Engineering
- Food & Nutrition
- General Science
- Genetics & Molecular Biology
- Immunology & Microbiology
- Medical Sciences
- Neuroscience & Psychology
- Nursing & Health Care
- Pharmaceutical Sciences
Research Article - (2024) Volume 15, Issue 1
Characterization of New Atherosclerosis Imaging Ligands with Aminomethylpyridinyl-Tetraazacyclododecane Group Using Liquid Chromatography and Tandem Mass Spectrometry
Weihsi Chen*, Chienchung Hsia, Siaosyun Guan and Chengliang PengReceived: 06-Dec-2023, Manuscript No. PAA-23-24274; Editor assigned: 08-Dec-2023, Pre QC No. PAA-23-24274 (PQ); Reviewed: 22-Dec-2023, QC No. PAA-23-24274; Revised: 29-Dec-2023, Manuscript No. PAA-23-24274 (R); Published: 05-Jan-2024, DOI: 10.35248/2153-2435.24.15.766
Abstract
Macrophage expression C-X-C motif chemokine receptor 4 (CXCR4) plays important role in inflammation and induces atherosclerosis. Two novel similar small molecular CXCR4 antagonists with aminomethylpyridinyl and macrocyclic tetraazadodecanyl groups, known as APD and APO, were designed and synthesized and then used as radio-imaging agents (after chelating with radio isotope of gallium ion) for atherosclerosis diagnosis using an ApoE-/- mouse model. By PET/CT scanning, the imaging performance of 68Ga-APD on atherosclerotic animal model surpasses over 68Ga-APO. The structures of the complexes of the ligands with gallium, impurities in APD and metabolites of APD in serum were analyzed using High-Performance Liquid Chromatography (HPLC) and tandem mass spectrometry. The HPLC method based on a C-18 column (25 cm × 4.6 mm and 5 µm) and mobile phase made of programed gradient aqueous acetonitrile spiked with 0.05% trifluoroacetic acid at a flow rate of 0.8 mL min-1. According to tandem mass spectra and fragmented patterns, both complexes of APD and APO with Ga3+ undergo ligand chelation with a metal ion, releasing two protons from the tetraazacyclododecane of APD and the acetyl acid of APO, respectively. The impurities in APD ligand are its partially degraded products with MW values of 256, 349 and 411. Three metabolites of APD in serum were identified after incubation for up to 2 h. The metabolic reaction of APD results in the degradation and release of tetraazacyclododecane, oxidative deamination, and hydroxylation products. The results of the characterization of APD-like ligands used for vascular disease diagnosis base on radio imaging and biostability are satisfactory.
Keywords
APD; Imaging of vascular blocked; Identification of metabolite; Tandem mass spectroscopy; Atherosclerosis radio-imaging agent; CXCR4
Abbreviations
APD: N-((6-(aminomethyl)pyridin-2-yl)methyl)-3-(1,4,7,10-tetraazacyclododecan-1-yl)-N-(pyridin-2- ylmethyl)propan-1-amine; APO: 2,2‘,2’‘-(10-(2-(bis((6-(aminomethyl)pyridin-2-yl)methyl)amino)-2-oxoethyl)-1,4,7,10- tetraazacyclododecane-1,4,7-triyl)triacetic acid; HPLC: High Performance Liquid Chromatography; MW: Molecular Weight; ApoE−/−: Apolipoprotein E-deficient; CXCR: CXC Chemokine Receptor; MS: Mass Spectrometry, MS/ MS: tandem Mass Spectrometry; TBR: Target-to-Background Ratio; CAD: Coronary Artery Disease; LDL: Low- Density Lipoprotein; PET/CT: Positron Emission Tomography/Computed Tomography; FDG: 2-deoxy-2-[18F] fluoroglucose; NARI: National Atomic Research Institute; DOTA: tetraazacyclododecane-1,4,7,10-tetraacetic acid; ESI: Electrospray Ionization; TFA: Trifluoroacetic Acid; PBS: Potassium Buffer Solution; PVDF: Polyvinylidene Difluoride; EPI: Enhance Product Ion; MRM: Multiple Reaction Monitoring; MALDI-TOF: Matrix-Assisted Laser Desorption/Ionization-Time Of Flight Mass Spectrometry; XIC: Extraction Ion Count; ER: Enhance Resolution; LOQ: Limit Of Quantification; LOD: Limit of Detection
Introduction
As the lifestyles of most contemporary people involve sitting for a long time and a lack of exercise, a diet high in fat and calories promotes the prevalence of vascular diseases, such as Coronary Artery Disease (CAD), vascular calcification, and hypertension. These diseases are strongly related to atherosclerosis and arteries blocked by lipid accumulation in the tunica intima. Atherosclerosis is a chronic and progressive arterial disease, it is asymptomatic until there is a severe event, at which point it is too late to recover [1]. Severe atherosclerosis causes cardio/cerebro-vascular problems with high fatality rate, including ischemic stroke and myocardial infarction [1,2], so the medical cost of treating patients is considerable. Following kidney disease, adiposity, and diabetes mellitus, the age levels of patients with cardio/cerebro-vascular diseases are declining, while the population ratio is increasing. The associated causes are excess lipids, glucose, and Low-Density Lipoprotein (LDL) cholesterol in the patient’s blood [2], which induce pro-inflammatory immune cells accumulation at the focal arterial wall [3]. Unheralded erosion and rupture plaques of chronic arterial inflammation result in thrombus formation, lumen occlusion at cardio- or cerebro-vascular parts and sudden death [1,4].
Molecular imaging agents target specific biomolecule and visualize the pathological lesions noninvasively. Imaging methodologies provide quantitative and specific information on an anatomic basis in clinical and preclinical studies to guide treatment strategies and predict fatal risks in patients [4,5]. A few Positron Emission Tomography (PET) imaging agents have been used to target biomarkers of atherosclerosis based on increasing glucose metabolism using inflammatory cells (18F-FDG) [6], and detecting micro-calcifications around the arterial wall (18F-NaF) [5,7]. However, both methods are only suitable for patients with advanced vascular blocked.
The CXC chemokine ligand 12 (CXCL12) and its CXC chemokine receptor 4 (CXCR4) play an important role in cell homeostasis, including mediating the recruitment of pro-inflammatory leukocytes to injured endothelial cells [8], and their accumulation in CXCR4-positive cells (such as differentiated macrophages and T cells), and subsequent plaque formation in atherosclerosis [9,10]. Therefore, CXCR4 is an attractive target for the development of molecular imaging agents to evaluate atherosclerosis or the level of vascular blockage in the early phase and then treat the related symptoms positively. Recently, the most promising PET agent for targeting CXCR4-related atherosclerosis has been the radioisotope 68Ga3+-labeled pentixafor (68Ga-pentixafor) [1,8,9]. Pentixafor is a peptide that targets CXCR4 while also chelating transition metals ion (Ga3+, In3+ and so on) via the triacetyltetraazacyclododecane (DOTA) group. However, the low Target-to-Background Ratio (TBR) of these tracers limited their application on clinical. Other polyazamacrocyclic based on CXCR4 antagonists (AMD3100 [11], AMD3465) [12], that chelate 64Cu2+ have also been developed and used to treat CXCR4-related diseases, including breast cancer and pulmonary granuloma, respectively. Since a few of groups develop novel imaging ligands for detection of CXCR4.
Two new, similar ligands, namely, N-((6-(aminomethyl)pyridin- 2-yl)methyl)-3-(1,4,7,10-tetraazacyclododecan-1-yl)-N-(pyridin- 2-ylmethyl)propan-1-amine (APD), and 2,2‘,2’‘-(10-(2-(bis((6- (aminomethyl)pyridin-2-yl)methyl)amino)-2-oxoethyl)-1,4,7,10- tetraazacyclododecane-1,4,7-triyl)triacetic acid (APO) (Figure 1), have been designed through computer simulation and screened by binding energy with CXCR4, on the basis of TIQ15 structural template. The activity center of the TIQ15-derived CXCR4 antagonists is tetrahydroqulinolin tertiary amine [13-15]. The computer simulation binding energy data for TIQ15 was -80 Kcal mol-1, however APD was -300.3 (in-house and unpublished data). Both ligands have been synthesized and patented [16], by National Atomic Research Institute (NARI) and are currently been tested to compare their performance with that of 68Ga-pentixafor on an apolipoprotein E-dificient mouse (ApoE-/-) model [17] for the detection of the atherosclerosis phase [3]. The two ligands comprise three parts: The phamacophore (aminomethylene-pyridinyl moiety), which recognizes the target (CXCR4); the chelator (tetraazamacrocyclic moiety), which chelates radio-transitional metal ions and carries traceability; and the linker, which connects the other two parts, provides space between pharmacophore and chelator, and provides various flexibilities. The main structural differences between APD and APO are as follows. First, APO has one aminomethylene (NH2CH2-, H-bond donor) on each of two pyridinyl (H-bond acceptor) groups, whereas APD has only one pyridinyl group with an aminomethylene group but the other pyridinyl group nothing. Second, APO has tri-acetyl acid and an amido groups on tetraazacyclododecane (DOTA), whereas APD comprises simple amines of tetraazacyclic dodecane (cyclen). The main difference between their linkers is that APD uses -(CH2)3-and APO uses acetoamide. Theoretically, APO should be able to bind to CXCR4 with greater affinity because of more H-bonds to CXCR4 and a stronger chelating ability with Ga3+ than APD. DOTA is a more common chelator of Ga3+ [18,19], than tetraazamacrocyclic molecule [11]. The complexation constant (log K) of Ga3+-DOTA is 26.05 [18].
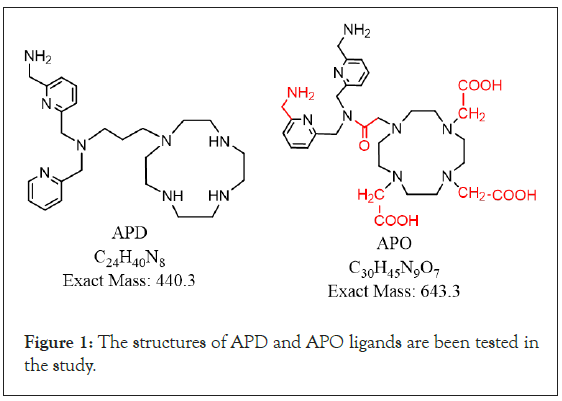
Figure 1: The structures of APD and APO ligands are been tested in the study.
In this study, the structural characteristics of the APD and APO ligands are investigated by Electrospray Ionization tandem Mass Spectrometry (ESI-MS/MS), including structural fragmented patterns and complexation status with Ga3+ ion. The identities and content of impurities and metabolites of APD in serum are also determined using High Performance Liquid Chromatography (HPLC) and tandem MS. The results of the characterization of APD and its analog APO are critical for its employ it proper use as an atherosclerosis imaging ligand.
Materials and Methods
Materials
The APD and APO ligands were contracted and synthesized at RDD Lab INC., Taiwan. Both compounds were quality assayed by HLPC (Waters-2695 with UV detectors and purity over 96%), nuclear magnetic resonance (JNM-ECZ500R/S1, JOEL, USA) and MS (4000QTRAP®, AB Sciex, Canda) before delivery. APD is an off-white semiviscous solid (MW: 440) and APO (MW: 643) is powdered. The non-radioactive complexes of Ga-APD/Ga-APO were prepared using the following procedures [3]: APD (0.1 mg) or APO (0.15 mg) ligands were dissolved in a 1-mL acetate buffer (pH 5.0–6.0), and an aqueous solution of non-radioactive gallium chloride (40 µg in 10 µL, 23 mM) was added to the buffer in a 1:1 mole ratio for at least 20 min at 65 ± 5°C. If the pH of complexation solution lower than 5, APD was protonated and unfavorable to chelate with Ga3+, and higher than pH 6, Ga3+ formed gallium hydroxide (Ga(OH)3) colloid. After completing all other animal tests, blood was drawn from a contrast-controlled mouse group and separated the serum by centrifuging, then stored at -70°C until metabolism study (no more than a month) to reserve activity of enzymes.
Instrument
The solutions of APD were analyzed by HPLC (Agilent 1200, Palo Alto, CA, USA) with a degasser, a thermostat (10°C) autosampler (5 µL of sample solution), a binary pump, a column oven at 22°C, and diode array detector (at 260 nm) operated by Chem Station software (Rev. B 0304) to determine of purity and amount of derivatives. HPLC analysis of APD on a C18 column (Fortis, length 25 cm, i.d. 4.6 mm, particle size of 5 µm) and mobile phase composed of deionized water (A phase) and acetonitrile (B phase) in the programmed gradient (Table 1). Both the A and B phases were modified with Trifluoroacetic Acid (TFA) 0.05% as the ion pairing agent of APD. The impurities and metabolites in the serum matrix were identified using a 4000QTRAP® mass spectrometry instrument (equipped with electrospray ionization triple quadrupole linear ion trap in positive ion scanning mode operated by Analyst software 1.6.2). Here, N2 gas obtained from a nitrogen generator (PEAK Scientific, Scotland, UK) was the gas used for mass spectrometry analysis, including the nebulizer, curtain, and collision gases.
| HPLC | |
|---|---|
| Stationary phase | Fortis-C18, 250 mm × 4.6 mm, 5 mm |
| Injection volume | 5 μL |
| Detector | DAD at 260 nm |
| Mobile phase | A: 0.05% TFA/DI water |
| B: 0.05% TFA/acetonitrile | |
| Gradient program | 0~3 min 5% B, isocratical; 3-10 min ramp to 15% B and 10-12 min to 30% B; with A+B=100%; isocratical till 15.0 min then down to 5% B to re-condition of column |
| Flow rate | 0.8 mL min-1 |
| Mass spectrometry | |
| Source temperature (°C) | 400°C |
| Detector polarity | Positive ion |
| Scanning mass range | 150–800 at 1000 Da sec-1 |
| Resolution, Q1 and Q3 | Unit |
| Curtain gas (p.s.i.) | 40 p.s.i. |
| Ion source gas 1 and 2 (p.s.i.) | 20 p.s.i. |
| Collision gas | Medium or High for EMS and EPI modes, respectivelya |
| Ion spray voltage (V) | 5200 V, positive |
| Declustering potential (V) | 60 V |
| Collision energy (V) | Ramping scan 10-45 V |
| Collision energy spread (V) | 10 V |
| Flow rate | Coupled with LC via splitter (1:10); Infusion directly by syringe pump (MS2 mode) at 10 mL min-1 |
Note: a EMS=Enhanced Mass Spectrometry; EPI=Enhanced Product Ion; DAD: Diode Array Detector; TFI=Trifluoroacetic acid; DI=Deionized water; V=Voltage; p.s.i.=pounds per square inch.
Table 1: Parameters of HPLC and mass spectrometry analysis for APD, APO ligands and gallium complexes.
Experimental
For the APD metabolism study of the serum, 20 µL of 0.5-M potassium phosphate solution (pH 7.4, PBS), 180 µL of deionized water, 20 µL of NADPH A, 4 µL of NADPH B, and 10 µL of APD (1500 µg mL-1) were mixed with 0.5 mL of serum for up to 2 h in a 2-mL Eppendorf tube before incubation in a preheated 37°C water bath [20]. Following this, the APD/serum solution was incubated in a 37°C thermostat bath while shaking (at 120 rpm) for 0, 10, 30, 60, 90 and 120 min before 100 µL of the incubated solution was dispensed into other tubes with the addition of 150-µL acetonitrile. The tubes were then vortexed and placed in an iced bath to stop the reaction. The six tubes were then centrifuged at 12,000 rpm for 10 min before the supernatant from the reacted solutions was filtered through a 0.2- µm disk filter (PVDF) into HPLC vials and stored at -20°C prior to HPLC and MS/MS operations, no more than a week to keep from deteriorating of APD and its derivatives.
Mice and PET/CT acquisition
Male ApoE-/- mice (provided from National Laboratory Animal Center) (aged>8 weeks) housed in controlled room (22 ± 2°C and 50 ± 5% relative humidity) with normal light-and-dark cycle and feed for 2 months high-fat diet for accelerating atherosclerotic plaque. PET/CT imaging was performed by Bioscan NanoPET/ CT scanner (Washington DC, USA). The mice were anesthetized during imaging after intravenous administration of 11.1 MBq (0.3 mCi) of [68Ga]‐APD. TBR was calculated by placing a circular 2 mm volume of atherosclerotic plaque divided by blood pool.
Results and Discussion
Tandem mass spectra and fragmentation patterns of APD, APO and Ga3+ complexes
To determine of the identities of the unknown derivatives related to the tested ligands using ESI-MS/MS, the standard mass spectra of both APD and APO were first plotted. The relevant parameters of MS were tuned by direct infusion of the ligands solutions in aqueous acetonitrile (1:1) buffered with both of 0.05% formic acid, as outlined in Table 1. For APD, the exact mass is 440.3. Based on the positive ion mode Enhance Product Ion (EPI) scanning of molecular ion, the [APD+H]+ (m/z 441.3 dalton, Da) fragmentation mass spectra and corresponding structures are plotted in Figures 2a and 2b. The broken bonds occur at the macrocyclic moiety and are partially recyclized, and the propylene linker moiety (indicated by the red dotted line). For the other ligand, the [APO+H]+ (m/z 644.3 Da) fragmentation mass spectra and corresponding structures are plotted in Figures 3a and 3b. The broken bonds occur at the carboxyl and acetyl acid of polyazamacrocycle, and acetoamide linker. However, the polyazamacrocycle part of APO dose not decompose as dose APD.
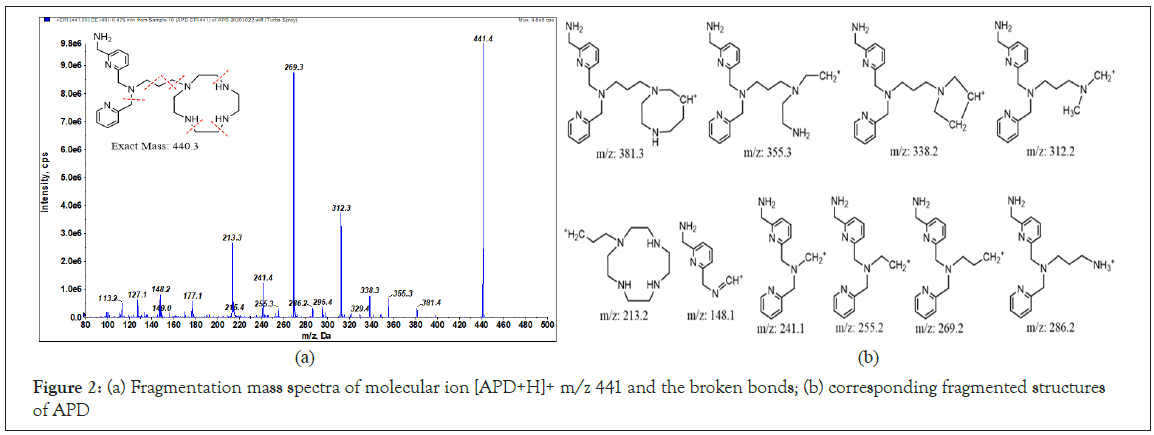
Figure 2: (a) Fragmentation mass spectra of molecular ion [APD+H]+ m/z 441 and the broken bonds; (b) corresponding fragmented structures of APD
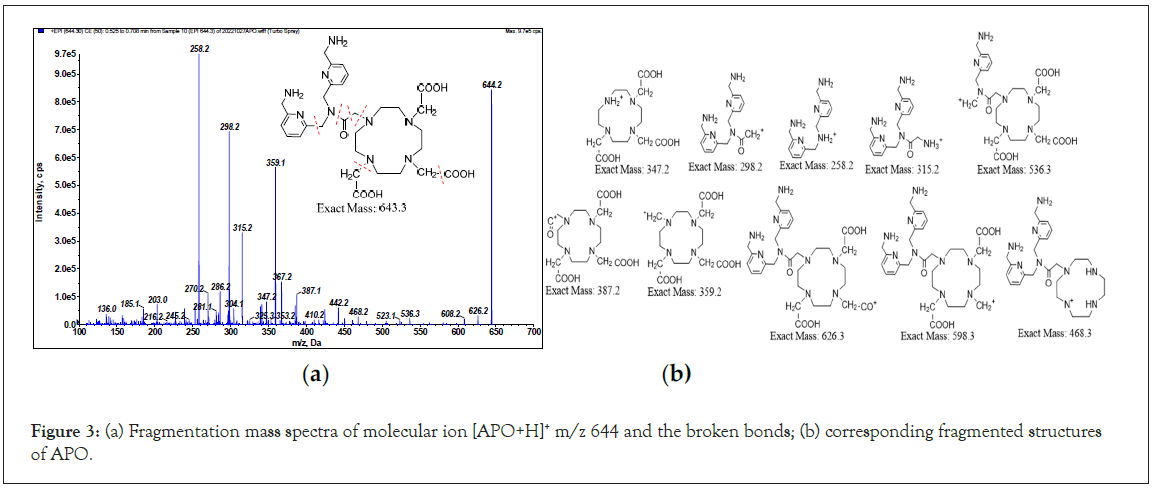
Figure 3: (a) Fragmentation mass spectra of molecular ion [APO+H]+ m/z 644 and the broken bonds; (b) corresponding fragmented structures of APO.
As the top two relative intensive of fragmented ions for APD are 269.3 and 312.3 Da, the appropriate Multiple Reaction Monitoring (MRM) ion pairs for the quantification of APD by liquid chromatography tandem MS (LC-MS) set at m/z 441.3 → 269.1 and 312.3. For the APO ligand, the appropriate MRM ion pairs are 644.2 → 258.2 and 298.2 Da.
It is imperative to confirm the state of a complex used as an imaging agent to diagnose of diseases. In order to make sure sufficient gallium-ligand complexes for mass spectrometry analysis, complexes of both ligands, APD and APO with gallium (Ga-APD and Ga-APO), were prepared in an aqueous acetate buffer solution in a 1:1 molar ratio for the non-radioactive version (69,71Ga3+) even though the PET imaging agent version for in vivo animal model reaction under a 105:1 ligand to 68Ga3+molar ratio (0.1 mg: 10 mCi) [3].
The most stable aqueous state of gallium ion in is Ga3+ with six coordination numbers, and its chemical character is similar to that of Fe3+ ion [21]. The high resolution mass spectra (matrix-assisted laser desorption/ionization-time of flight mass spectrometry, MALDI-TOF, Ultraflex III, BRUKER) of the Ga-APD complex show its molecular ion m/z at 507.3, 508.3, 509.3 and 510.3 (Figure 4a); moreover, the peak height ratio of 507:509 is to 3:2 (isotope abundance ratio of 69Ga:71Ga=60:40). Therefore, the m/z 507 ion is a complex of Ga3+ with +1 charge. The fragmented mass spectra (using 4000QTRAP) of m/z 507 (Figure 4b), and corresponding fragmented structures support the hypothesis that APD releases two protons from three secondary amines of cyclen (APD2-) and then chelates Ga3+ to form a tetradentate complex of [69,71Ga3+-APD2−]+ (MW: 507 or 509). Except in strong base reactions, it is difficult for a secondary amine to lose a proton. Therefore, the reason accounts for the equilibrium constant and concentration unfavorable [Ga3+- APD2−]+ complexation. However, when labeling radioactive Ga3+, APD was more dominant than gallium ion, and according to LeChatelier’s principle, all 68Ga3+ was chelated by APD, and no free 68Ga3+ remained in the 68Ga3+-APD solution after inspection using a radiodetector coupled with thin layer chromatography and HPLC [3]. For PET imaging, a trace amount of 68Ga3+-APD is sufficient (68Ga3+ less than 0.4 mCi per mouse, around 9.5 pg) [3].
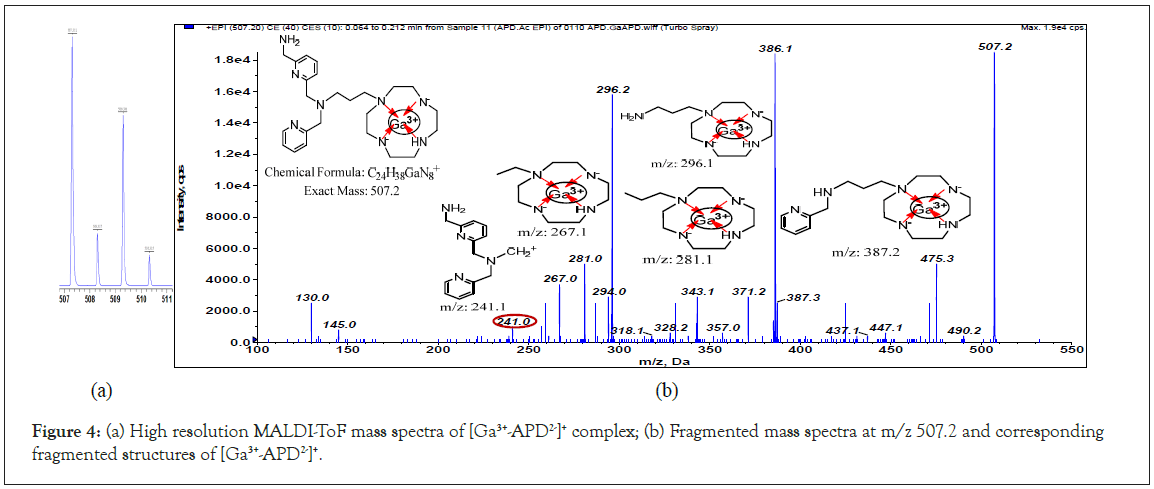
Figure 4: (a) High resolution MALDI-ToF mass spectra of [Ga3+-APD2-]+ complex; (b) Fragmented mass spectra at m/z 507.2 and corresponding fragmented structures of [Ga3+-APD2-]+.
Although the imaging agent 68Ga3+-APD is available, we attempted to design another ligand to improve the performance of APD. One approach involves the enhancement of hydrogen bond interactions with the target protein by adding more a methylene-amine to the other pyridinyl group. Another approach involves intensifying the complexation ability of gallium by substituting cyclen with DOTA. After releasing two protons from the acetyl acid groups, the APO2- ligand provides hexadentate (tetraaza and two carboxylates) to Ga3+ and saturates its coordination orbitals to form [69,71Ga3+-APO2-]+, MW: 710, 712. The Enhanced resolution (ER) spectra show that the peak height of m/z 710 and 712 is 3:2. The fragmented mass spectra of m/z 710 and corresponding structures are plotted in Figures 5a and 5b. The broken bonds occurred at the linker (shown in red dotted line). The fragmented patterns of the Ga-APD, Ga- APO complexes are partially similar to those of the ligands. The LC-MS detection (extracted ion count mode, XIC) chromatograms of the Ga-APD labeled solution showed that the m/z 441 peak is large (much of APD remained in solution); however, the peak of Ga-APO labeled solution at m/z 644 was insignificantly (almost all of APO chelated with Ga3+).
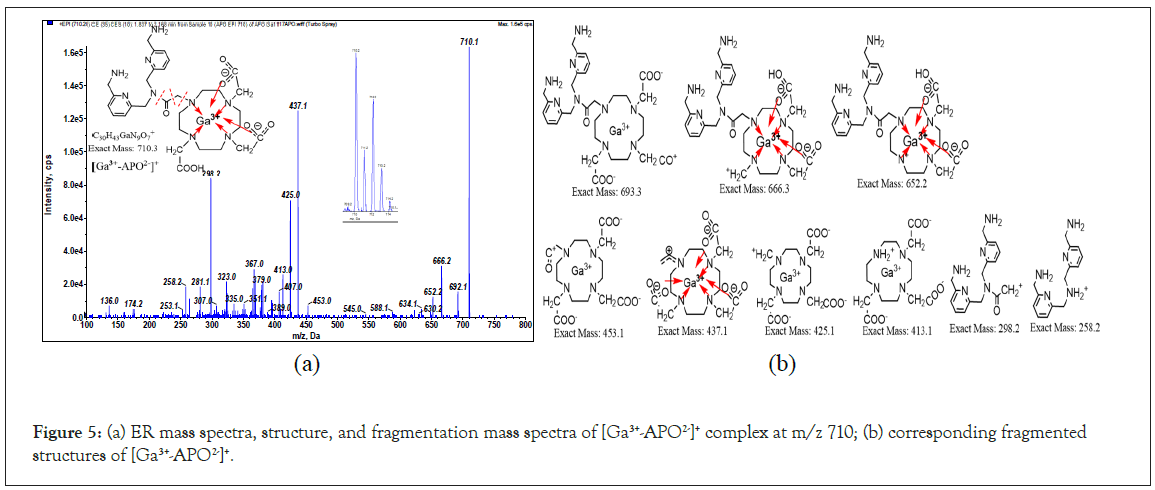
Figure 5: (a) ER mass spectra, structure, and fragmentation mass spectra of [Ga3+-APO2-]+ complex at m/z 710; (b) corresponding fragmented structures of [Ga3+-APO2-]+.
PET/CT studies on ApoE-/- atherosclerotic mice
For comparing the TBR between [68Ga]-APD and [68Ga]-APO, tracers were injected from the tail vein with the same radioactivity (0.3 mCi) to 2 months age high-fat diet ApoE-/- mice. The results demonstrate that the TBR of [68Ga]-APD and [68Ga]-APO was 9.02 ± 0.86 and 3.32 ± 0.71 (n=3), respectively. Based on PET/CT graphs, the performance of 68Ga-APD and 68Ga-APO administrated to ApoE-/- mice were compared. The results show the biodistribution of 68Ga-APD in the aorta and its PET/CT graphs of 68Ga-APD specifically binding at atherosclerotic site (Figure 6a). However, the performance of 68Ga-APO was negative (Figure 6b). Although APO chelates Ga3+ were suspected to be 273 better than APD, it didn’t specifically and efficiently attach to CXCR4. One plausible explanation is that the linker or space between the pharmacophore and macrocycle is too close or less flexible, resulting in more steric hindrance interference from binding to the receptor (DOTA is larger than cyclen). Another possible reason is that the second aminomethylene (-CH2NH2, H-bond donor) hinders pyridinyl from accepting H-bond from CXCR4. Therefore, the subsequent discussion on the identification of impurities and metabolites focuses on APD.
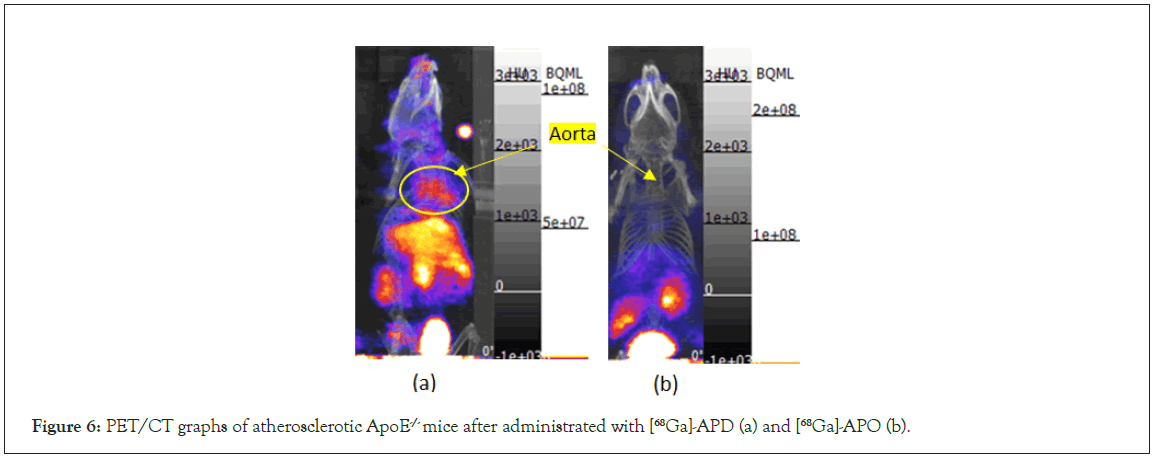
Figure 6: PET/CT graphs of atherosclerotic ApoE-/- mice after administrated with [68Ga]-APD (a) and [68Ga]-APO (b).
Identification of impurities in APD by HPLC and tandem mass spectrometry
The APD ligand is an alkaline and polar molecule with pyridinyl, 1°, 2°, and 3° amino groups and multi-hydrogen bonds with proteins to recognize biomolecules and is highly dissolved in water. In aqueous solution, APD is protonated into positive charges ion and without any retention effect on reverse phase column, for example C18, C8 and amino group modified (normal phase) column. All HPLC analytical trials were failed (coeluted with system peak) except for the mobile phase is is spiked with TFA as the ion pairing agent with APD on C18 column (25 cm). According to the chromatogram (Figure 7), of APD at 9.07 ± 0.1 min with chromatographic purity of 97.0%, a theoretical plate number of 68000, a dynamic range of 16.8–1680 ppm with a calibration equation A=3.81 × conc. (ppm)– 73.8, a coefficient of 0.9995, a Limit Of Quantification (LOQ) of 4.5 ppm, and a Limit Of Detection (LOD) of 1.7 ppm. There were four impurity peaks at retention time (tR) of 9.4, 9.66, 9.82, and 10.65 min, with peak area of 0.22%, 1.15%, 0.63%, and 0.85%, respectively. According to the LC-MS (XIC) and ER scanning mode, the m/z values of the four impurities were 257, 350, 412, and 455 sequentially.
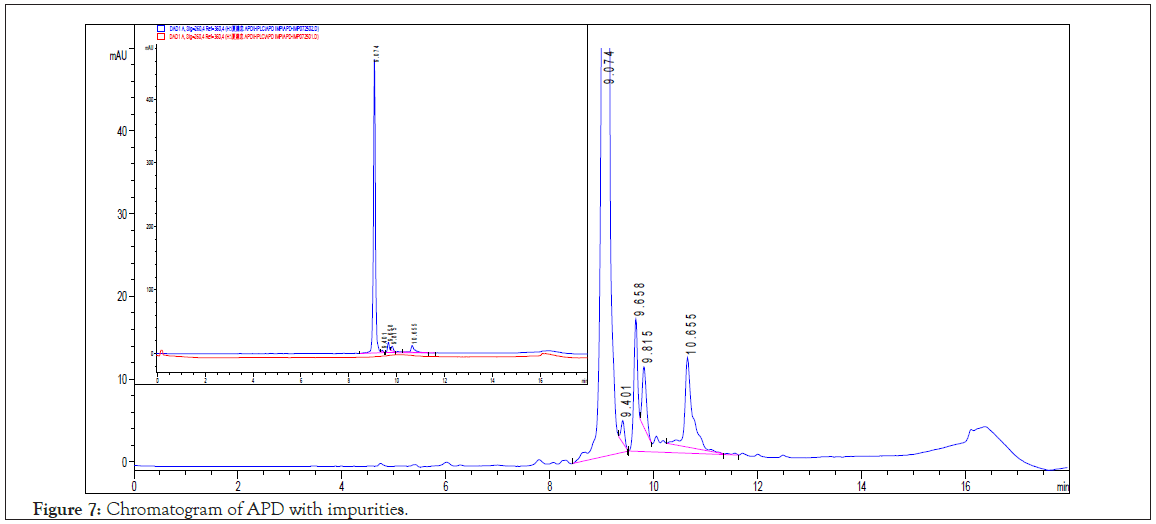
Figure 7: Chromatogram of APD with impurities.
The identities of impurities in APD were determined by fragmenting the molecular ions m/z to obtain structural details. The fragmented mass spectra and corresponding structures of the four impurities are shown in Figures 8a-8d with MW 256, 349, 411 and 455. The identities of the first three impurities are constituents of APD. The last one is suspected and has yet to be determined.
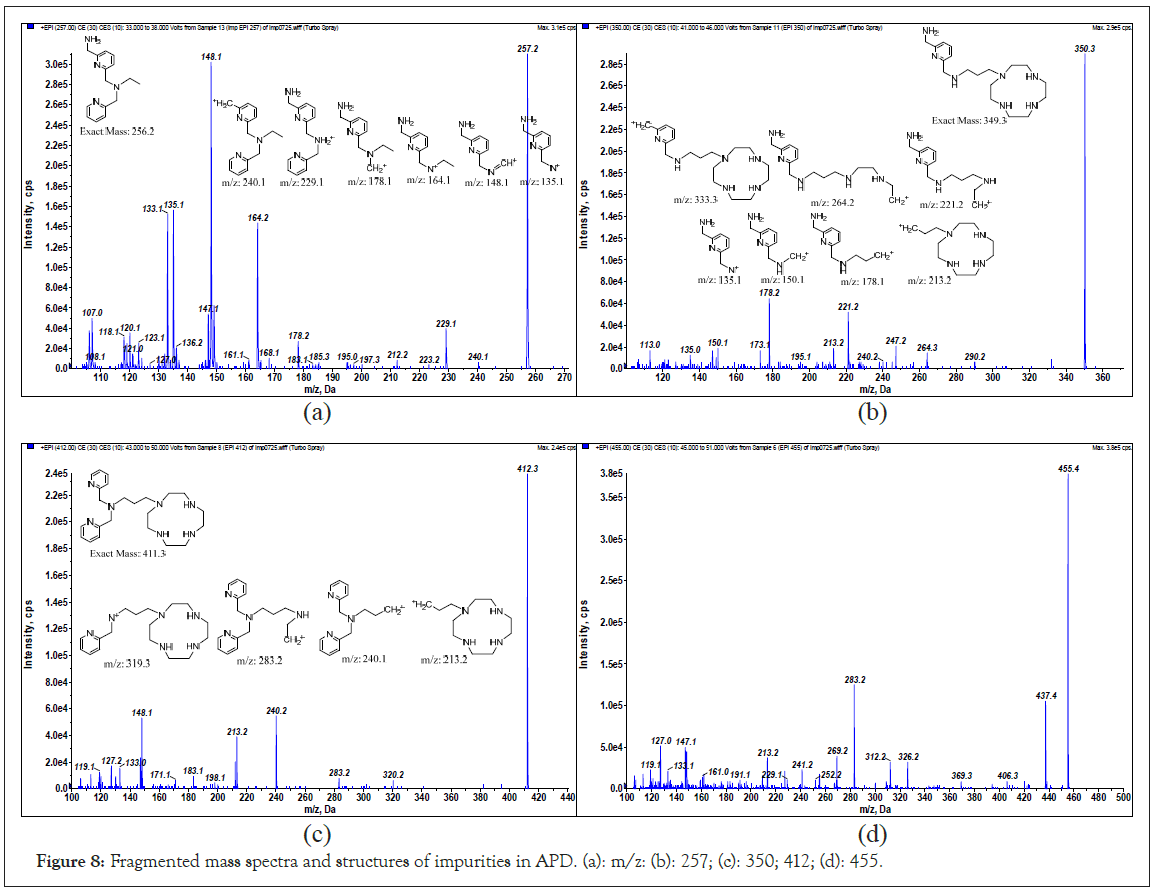
Figure 8: Fragmented mass spectra and structures of impurities in APD. (a): m/z: (b): 257; (c): 350; 412; (d): 455.
Determination of metabolites of APD in serum
The 68Ga-APD complex solution was administered intravenously to the animal, which was circulated throughout the body through the vascular system, before attaching CXCR4 at inflamed tissue or atherosclerotic sites. During this period, 68Ga-APD/APD ligand coexists with blood and may be biotransformed by enzymes in plasma. The biostability of an imaging agent affects the effectineness and resolution of a portrait. To profile the characteristics of imaging agents in biosystems, it is necessary to investigate reaction trends and determine metabolites after incubation in serum for up to 2 h via LC and tandem mass spectra [22,23]. Because the APD ligand is much surplus over the 68Ga-APD complex, the metabolism study focus on APD.
The chromatograms of APD solution after incubation with serum for 0, 10, 30, 60, 90, and 120 min (Figure 9a) show the chromatographic peaks of the metabolites at tR 5.27 (M1) and 8.44 min. The peak at 8.44 min is an unresolved multicomponent peak (M2 and M3). The declining tendency of the APD peak area is plotted in Figure 9b, showing that more than 70% of APD remains in the incubation solution for 1 h. The biostability of APD in serum was acceptable for using as an imaging agent. It takes less than 1 h for the mouse. Because the half-life of 68Ga is 68 min, the period of PET imaging suggests less than 1 h.
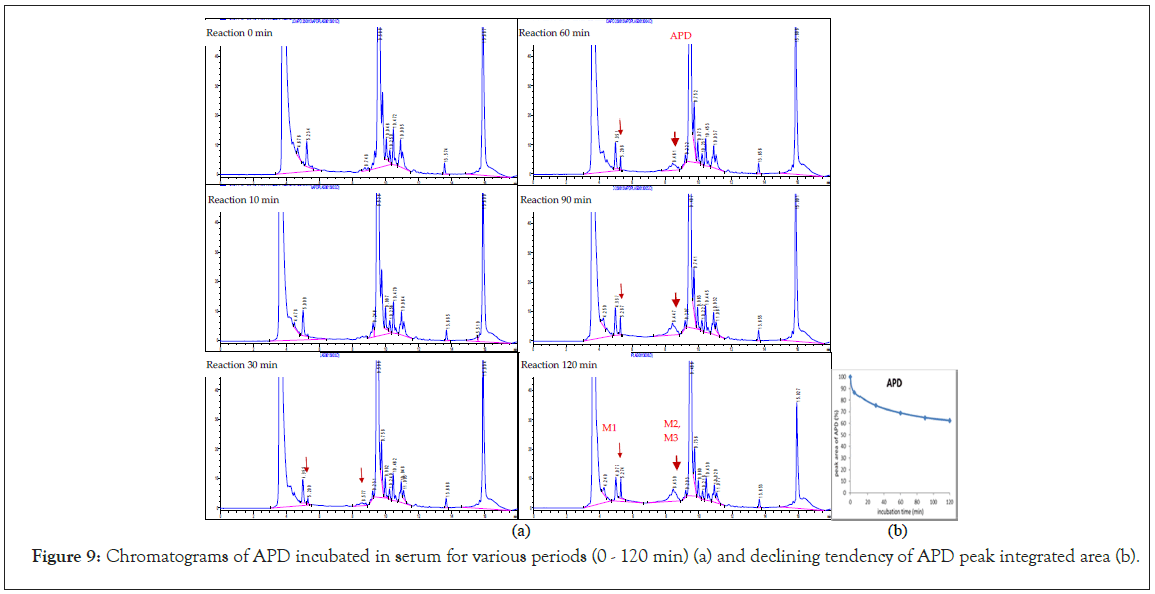
Figure 9: Chromatograms of APD incubated in serum for various periods (0 - 120 min) (a) and declining tendency of APD peak integrated area (b).
According to the LC-MS (XIC mode) and chromatography of the incubation solutions for 60–120 min, the m/z values of metabolites were suspected to be 273 (tR=5.27 min, M1) and 442, 457 (tR=8.44 min, M2 and M3, unresolved multipeak). The fragmented mass spectra and corresponding structures of the APD metabolites are shown in Figures 10a–10c. The M1 metabolite (MW 272) is a decomposed/hydroxylated product at the APD linker that has lost cyclen, resulting in the loss of Ga3+ and traceability. The M2 metabolite (MW 441, +1 than APD) is an oxidative deamination reaction (+OH, -NH2) at methylene amine. The M3 metabolite (MW 456, +16 than APD) is a hydroxylation product at one CH2 of the tertiary amine, (CH2)3N [24]. The three metabolites are phase I oxidization. Despite the three metabolites being determined in vitro with serum for 2 h in small amounts, the PET imaging of the Ga-APD agent in an animal model [3], for less than 1 h showed that the agent was mostly distributed in the kidney and bladder. This indicates that the Ga-APD complex is highly soluble in aqueous solutions and is quickly eliminated through the urinary system before metabolized. The metabolism of APD in serum is summarized in Figure 11.
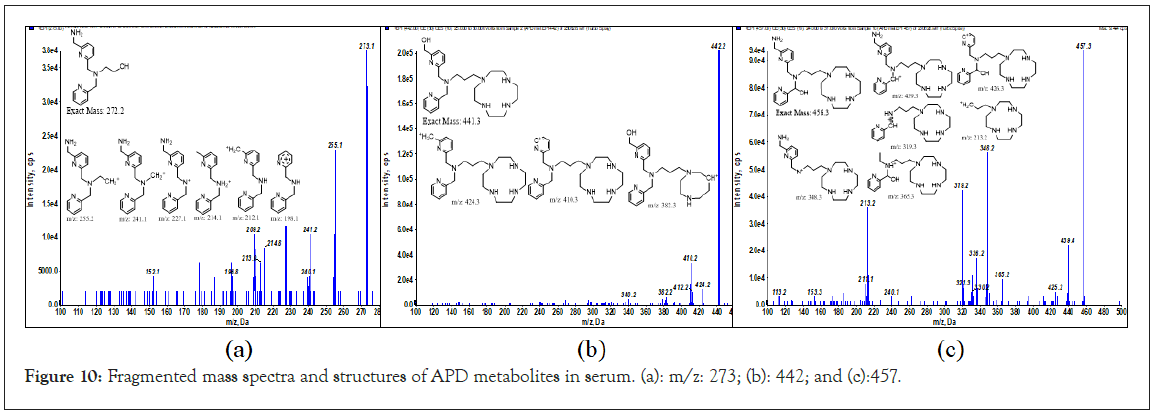
Figure 10: Fragmented mass spectra and structures of APD metabolites in serum. (a): m/z: 273; (b): 442; and (c):457.
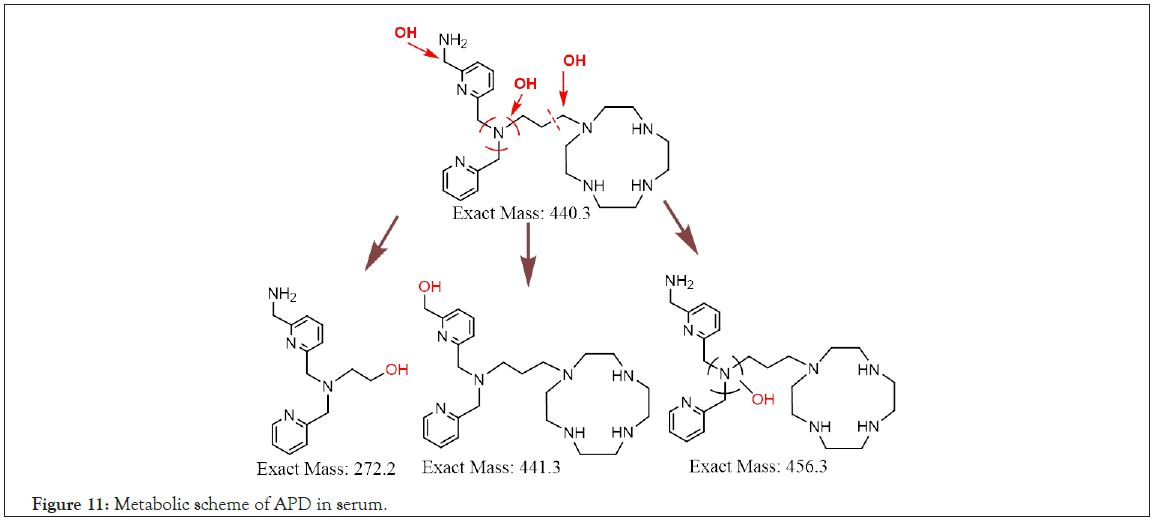
Figure 11: Metabolic scheme of APD in serum.
Conclusion
This study presents an overview of the results of HPLC and tandem mass spectra for APD and its analog APO, both of which complex with Ga3+ to form [Ga3+-APD2-]+ and [Ga3+-APO2-]+, tetradentate and hexadentate complexes, respectively, even though the equilibrium constant of [Ga3+-APD2-]+ is unfavorable for complexation with gallium. Tandem mass spectra confirmed the release of two protons from the aza amine of cyclen and the acetyl acid of DOTA, forming APD2- and APO2-, respectively, and then chelating Ga3+. The tandem mass spectra and corresponding fragmented structures support the identification of APD-related impurities and unknown metabolites. The metabolism type of APD in serum is phase I oxidation. Because the half-life of positron emission 68Ga3+ is 68 min, the PET imaging time is less than 1 h. APD biostability in blood has a negligible impact on atherosclerotic diagnosis. The atherosclerotic imaging performance of 68Ga-APD is much excellent than that of 68Ga-APO and deserves more application research.
Author Contributions
Chienchung Hsia designed the ligands and managed the project and the labeled reaction. Chengliang Peng manipulated the animal model. Siaosyun Guan acquired the high-resolution mass spectra (MALDI-ToF). Weihsi Chen performed HPLC, triple quadrupole linear ion trap tandem mass spectrometry, data elucidation and organized the manuscript. All authors have read and agreed to the published version of the manuscript.
Sources of Funding
This research grant and the article processing charge was funded by National Atomic Research Institute, Taiwan [Grant No. AIE- 01030201].
Conflict of Interest
The authors declare that no conflict of interest.
References
- Lu X, Calabretta R, Wadsak W, Haug AR, Mayerhöfer M, Raderer M, et al. Imaging inflammation in atherosclerosis with CXCR4-directed [68Ga]PentixaFor PET/MRI—compared with [18F]FDG PET/MRI. Life (Basel). 2022;12(7):1039-1049.
[Crossref] [Google Scholar] (All versions) [PubMed]
- Herrington W, Lacey B, Sherliker P, Armitage J, Lewington, S. Epidemiology of atherosclerosis and the potential to reduce the global burden of atherothrombotic disease. Circ Res. 2016;118(4):535–546.
[Crossref] [Google Scholar] [PubMed]
- Hsia CC, Yeh CH, Chen C.T, Peng CL. Imaging the cytokine receptor CXCR4 in atherosclerotic plaques with [68Ga]-APD: A novel agent on computer simulation approach. J Clin Cell Immunol. 2022;13(5):1-7.
[Google Scholar] (All versions)
- Jaffer FA, Libby P, Weissleder R. Molecular imaging of cardiovacular disease. Circulation. 2007;116(9):1025-1061.
[Crossref] [Google Scholar] (All versions)
- AlJaroudi WA, Hage FG. Review of cardiovascular imaging in the Journal of Nuclear Cardiology 2020: Positron emission tomography, computed tomography, and magnetic resonance. J Nucl Cardiol. 2021;28(5):2100-2111.
[Crossref] [Google Scholar] (All versions) [PubMed]
- Rudd JH, Myers KS, Bansilal S, Machac J, Pinto CA, Tong C, et al. Atherosclerosis inflammation imaging with 18F-FDG PET: Carotid, iliac, and femoral uptake reproducibility, quantification methods, and recommendations. J Nucl Med. 2008;49(6): 871-8.
[Crossref] [Google Scholar] [PubMed]
- Fiz F, Morbelli S, Piccardo A, Bauckneht M, Ferrarazzo G, Pestarino E, et al. 18F-NaF uptake by atherosclerotic plaque on PET/CT imaging: Inverse correlation between calcification density and mineral metabolic activity. J Nucl Med. 2015;56(7):1019-23.
[Crossref] [Google Scholar] [PubMed]
- Kircher M, Tran-Gia J, Kemmer L, Zhang X, Schirbel A, Werner RA, et al. Imaging inflammation in atherosclerosis with CXCR4-directed 68Ga-pentixafor PET/CT: Correlation with 18F-FDG PET/CT. J Nucl Med 2020;61(5):751–756.
[Crossref] [Google Scholar] (All versions) [PubMed]
- Weiberg D, Thackeray JT, Daum G, Sohns JM, Kropf S, Wester H-J, et al. Clinical molecular imaging of chemokine receptor CXCR4 expression in atherosclerotic plaque using 68Ga-Pentixaform PET: Correlation with cardiovascular risk factors and calcified plaque burden. J Nucl Med 2018;59(2):266–272.
[Crossref] [Google Scholar] [PubMed]
- Weber C, Noels H. Atherosclerosis: Current pathogenesis and therapeutic options. Nat Med. 2011;17(11):1410–1422.
[Crossref] [Google Scholar] [PubMed]
- Aghanejad A, Jalilian A, Fazaeli Y, Alirezapoor B, Pouladi M, Beiki D, et al. Synthesis and evaluation of [67Ga]-AMD3100: A novel imaging agent for targeting the chemokine receptor CXCR4. Sci Pharm. 2014;82(1):29–42.
[Crossref] [Google Scholar] [PubMed]
- Hu JS, Freeman CM, Stolberg VR, Chiu BC, Bridger GJ, Fricker SP, et al. AMD3465, a novel CXCR4 receptor antagonist, abrogates schistosomal antigen-elicited (Type-2) pulmonary granuloma formation. Am J Pathol. 2006;169(2):424-432.
[Crossref] [Google Scholar] [PubMed]
- Wilson RJ, Jecs E, Miller EJ, Nguyen HH, Tahirovic YA, Truax VM, et al. Synthesis and SAR of 1,2,3,4-Tetrahydroisoquinoline-based CXCR4 antagonists. ACS Med Chem Lett. 2018;9(1):17-22.
[Crossref] [Google Scholar] [PubMed]
- Jecs E, Miller EJ, Wilson RJ, Nguyen HH, Tahirovic YA, Katzman BM, et al. Synthesis of novel tetrahydroisoquinoline CXCR4 antagonists with rigidified side-chains. ACS Med Chem Lett. 2018;9(2):89-93.
[Crossref] [Google Scholar] [PubMed]
- Truax VM, Zhao H, Katzman BM, Prosser AR, Alcaraz AA, Saindane MT, et al. Discovery of tetrahydroisoquinoline-based CXCR4 antagonists. ACS Med Chem Lett. 2013;4(11):1025-1030.
[Crossref] [Google Scholar] [PubMed]
- Hsia CC, Yeh CH, Peng CL, Chen CT. Complex, contrast agent and method for treating a disease related to CXCR4 receptor 2022, Taiwan patent No. I781463 (2022), Japan patent No. 7239662. 2022.
- Sasso GL, Schlage WK, Boué S, Veljkovic E, Peitsch MC, Hoeng J. The ApoE−/− mouse model: A suitable model to study cardiovascular and respiratory diseases in the context of cigarette smoke exposure and harm reduction. J Transl Med 2016;14(1):146.
[Crossref] [Google Scholar] [PubMed]
- Kubicek V, Havlickova J, Kotek J, Tircso G, Hermann P, Tóth E, et al. Gallium(III) complexes of DOTA and DOTA-monoamide: Kinetic and thermodynamic studies. Inorg Chem. 2010;49(23):10960–10969.
[Crossref] [Google Scholar] [PubMed]
- Bandoli G, Dolmella A, Tisato F, Porchia M, Refosco F. Mononuclear six-coordinated Ga(III) complexes: A comprehensive survey. Coordination Chemistry Reviews 2009;253(1-2):56–77.
- Di L, Kerns EH, Hong Y, Chen H. Development and application of high throughput plasma stability assay for drug discovery. Int J Pharmaceutics 2005;297(1-2):110-119.
[Crossref] [Google Scholar] [PubMed]
- Gallium. Wikipedia. 2023.
- Tsujikawa K, Kuwayama K, Miyaguchi H, Kanamori Z, Iwata YT, Inoue H. In vitro stability and metabolism of salvinorin A in rat plasma. Xenobiotica 2009;39(5):391–398.
[Crossref] [Google Scholar] [PubMed]
- Wang G, Hsieh Y, Cheng KC, Ng K, Korfmacher WA. High-throughput cassette assay for drug stability measurement in plasma using direct HPLC-MS/MS. Spectroscopy. 2003;17:511–519.
- Ramanathan R, Comezoglu SN, Humphreys WG. Metabolite identification strategies and procedures, in Using Mass Spectrometry for Drug Metabolism Studies 2nd ed. by Korfmacher WA. 2009;Ch. 5. (p. 141).
Citation: Chen W, Hsia C, Guan S, Peng C (2023) Characterization of New Atherosclerosis Imaging Ligands with Aminomethylpyridinyl- Tetraazacyclododecane Group Using Liquid Chromatography and Tandem Mass Spectrometry. Pharm Anal Acta. 15:766.
Copyright: © 2023 Chen W, et al. This is an open access article distributed under the terms of the Creative Commons Attribution License, which permits unrestricted use, distribution, and reproduction in any medium, provided the original author and source are credited.
Sources of funding : This research grant and the article processing charge was funded by National Atomic Research Institute, Taiwan [Grant No. AIE-01030201].


