Indexed In
- Genamics JournalSeek
- JournalTOCs
- CiteFactor
- RefSeek
- Hamdard University
- EBSCO A-Z
- OCLC- WorldCat
- Publons
- Google Scholar
Useful Links
Share This Page
Journal Flyer

Open Access Journals
- Agri and Aquaculture
- Biochemistry
- Bioinformatics & Systems Biology
- Business & Management
- Chemistry
- Clinical Sciences
- Engineering
- Food & Nutrition
- General Science
- Genetics & Molecular Biology
- Immunology & Microbiology
- Medical Sciences
- Neuroscience & Psychology
- Nursing & Health Care
- Pharmaceutical Sciences
Research Article - (2021) Volume 10, Issue 9
Capacity of Interchange in Outer Connection Ramps
Jihad Obeidat*Received: 24-May-2021 Published: 06-Aug-2021, DOI: 10.35248/2168-9873.21.10.383
Abstract
Interchanges are constructed in urban and suburban areas to ease traffic operation. Outer connection ramps constitute a major part of interchanges planning and design. The objective of this study was to estimate interchange ramp capacity and investigate the impacts of ramp geometry on the obtained capacity. To achieve this objective, 20 ramps were selected, including 10 circular ramps and 10 curve- straight-curve ramps. Capacity of ramp proper and ramp exit were investigated in the study. At ramp proper, data on traffic speed and traffic flow were collected at 1-minute intervals using video camera. Also, traffic data for ramp exit and mainline traffic were obtained under queued traffic condition on the ramp exit. An empirical approach using regression analysis was adopted to estimate capacity of the selected ramps and explore the impact of geometric design and traffic variables that might affect the estimated capacity. For ramp proper, the analyses revealed that the relationship between traffic speed and density is linear and between speed and traffic flow is parabolic irrespective of ramp configuration. For circular ramps, the capacity was found to vary from 1470 to about 2100 pc/hr./lane, and it was found that ramp radius is the most influencing factor in capacity estimation. For curve-straight-curve ramps, the results indicated that the obtained capacity varied from 1490 to 2200 pc/hr./lane, and both the straight segment length and the radius of the first curve are the most influencing factors. Also, it was found that ramp exit capacity is affected by flow and speed of traffic in the mainline street and degree of curvature of ramp exit curve. Finally, it was concluded that the use of curves with large radii at ramp proper and exit would increase ramp capacity, and customization of capacity values to reflect local conditions would provide more realistic estimates.
Keywords
Interchange ramp; Capacity; Circular; Curve-straight-curve; Ramp exit capacity; Jordan
Introduction
Traffic congestion is one of the most important problems in large cities. This problem has many negative impacts on economy such as loss of time and increase in fuel consumption, environmental and health effects such as increasing the air pollution and noise levels [1]. Traffic congestion occurs when traffic demand exceeds capacity of a highway facility. To eliminate or reduce this problem in urban and suburban areas, interchanges are constructed to ease traffic movement. Outer connection ramps constitute a major part of interchange planning and design. Three types of outer connection ramps are normally used; simple circular curve ramps, curve – straight – curve ramps and reverse-curve ramps. Capacity estimates of ramps are vital for traffic engineers to provide the necessary geometry that can cope with traffic demand. Although capacity estimates are readily available in the Highway Capacity Manual, HCM 2016 [2], variation in drivers’ behavior, procedures of analyses and estimates, and geometric variables may play important factors in capacity estimates. In Jordan, traffic engineers used the HCM without any modifications to account for drivers’ behavior or local practices. As such, the objective of this study was to determine the capacity of interchange outer connection ramps and highlight effects of geometric design variables on the estimated capacity.
The Highway Capacity Manual, HCM 2010 [3] defined the capacity as the maximum number of vehicles that can pass through a point or uniform section of carriageway lane in one direction per hour under prevailing roadway, traffic, or ambient conditions. Manuals and studies [4,5] normally express the capacity in passenger cars per hour (pc/hr.). However, in estimating capacity of any non-uniform section, the section has to be divided into uniform subsections and capacity can be computed without violating capacity definition [6]. Outer connection ramps are composed of three major elements; ramp entrance, ramp proper (roadway segment between ramp entrance and ramp exit) and ramp exit. These elements are not uniform and the previous studies indicate that under such conditions sectioning method would be helpful in estimating capacity at each element separately in order to identify the critical one.
There are several methods which are used to estimate capacity such as headway models, expected extreme value method, fundamental diagram method based on macroscopic traffic variables (traffic flow, speed and density) and car following theory. Leisch [7] developed anemographs to estimate the capacity of ramp exit and ramp entrance sections for different freeway traffic, percentage of trucks, and level of services. For level of service C and zero percent of trucks, the ramp proper capacity was estimated at 1500 pc/hr. Also, Fang et al. [8] developed analytical models that estimate the capacities of interchanges and their components including basic section merge/diverge area, weaving area and typical ramps by using simulation experiments. For design speed 50 km/hr., the results indicated that the capacity of directional right turn ramp was 1900 pc/hr./lane. Martinez et al. [9] proposed recommendation about the best exit ramp layout by evaluating capacity of the exit ramp for different layouts using microsimulation analysis. For single lane exit, the proposed capacity varied from 1600 to 1800 pc/hr. Finally, the HCM 2010 indicated that for design speed 30 and 80 km/ hr., the capacity of ramp proper varied from 1800 to 2200 pc/hr., respectively.
Several studies investigated the effect of ramp flow on the main street capacity in the merging area. Kondyli et al. [10] indicated that higher demand on the on- ramps produces lower overall capacity values. New capacity values for merging junctions were developed as function of freeway and ramp demand and number of lanes along the mainline. In this analysis, the ramp flow to upstream flow ratio was found to negatively affect the merge capacity. Also, Al-Masaeid [11] reported that circular loop exit capacity is greatly affected by the mainline upstream demand on the outer lane.
Based on dynamics and gap acceptance theory in addition to time headway losses and lane changing processes, Xue et al. [12] proposed a model for estimating capacity of on-ramp merging section of urban expressway. The capacity models were developed as functions of volume ratios of the mainline and the ramp, the gap between optimal speed and the lane-changing speed of vehicles. According to microsimulation of on-ramp merging sections, the relationship between on-ramp flow and the flow of mainline lateral lane was elaborated based on four values of difference between the optimal speed and the lane-changing speed of vehicles to make comparisons between real data and microsimulation of on- ramp merging sections.
Methodology and Data Collection
The data were collected in the summer of 2017 for several interchange ramps in urban and suburban areas [13]. Two types of outer connection ramps were included in this study; simple circular and curve- straight-curve ramps. Data related to traffic flows and vehicle speeds were obtained through field study using video camera. Data on ramp geometric variables were obtained by Mapar software and AutoCAD civil 3D.
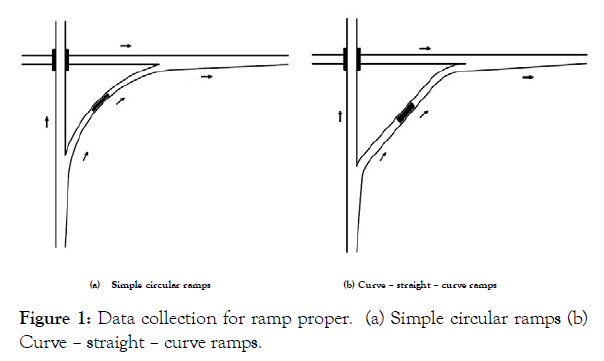
To obtain the capacity of ramp proper section, data were collected at 10 simple circular curve ramps and 10 curve – straight – curve ramps. Each selected ramp should have uniform cross section and is usually subjected to high traffic flows during peak periods such that capacity can be obtained under continuous queue traffic condition. Traffic flow rates and average speeds were extracted from video tapes. The number of vehicles and average speed were computed based on 1- min. time intervals. Manual speed traps were used to extract the speed data from the video tapes. The data were collected during peak and off-peak periods on each ramp proper to cover all conditions of traffic flow. As shown in Figure 1, the trap was located at the middle of the circular ramp proper and at the middle part of the straight section of curve-straight- curve ramp. It is worth mentioning that all investigated ramps consisted of one paved traffic lane with paved shoulders.
Figure 1: Data collection for ramp proper. (a) Simple circular ramps (b) Curve – straight – curve ramps.
Capacity at the ramp exit section is defined as the maximum number of vehicles that can leave the ramp when there is a continuous queue on the ramp lane. The ramp exit capacity at any time will depend on the level of conflicting traffic volumes and the vehicle speeds on the mainline street as well as geometric elements of the ramp exit. To obtain the capacity of ramp exit section, data were collected at 15 ramp exits. Traffic flow rates and average speeds for the outer two lanes on the main street and the traffic flow leaving the ramp were collected at the same time using 1 – min. intervals. In fact, all selected mainline streets were multilane, with two lanes in each direction. Manual speed traps were used to extract the speed data from the tapes. During the counting period, a stable queue of vehicles was available at the ramp exit while the mainline street was subjected to different traffic conditions. These conditions were necessary to estimate the ramp exit capacity [14].
Ramp geometric design variables for each selected ramp were measured by Mapar software and AutoCAD civil 3D. The measured variables included ramp type, curve radii, length of straight section in curve – straight – curve ramp, intersecting angle, grade of ramps and degree of curvature. Tables 1, 2, and 3 present the geometric characteristics of circular ramps, curve-straight-curve ramps, and ramp exits, respectively. Finally, all traffic streams were converted into passenger car (pc) units, using headway principles [15].
| Ramp No. | Ramp radius(m) | Degree of curvature(del 1; rec) | Intersection Angle(del 1; ree) | Grade(%) | No.of Observations |
|---|---|---|---|---|---|
| I | 148 | 11.8 | 114.1 | -3.2 | 24 |
| 2 | 149 | 11.7 | 102.5 | -3.8 | 27 |
| 3 | 302 | 5.8 | 63.5 | 0.6 | 35 |
| 4 | 70 | 24.9 | 127.6 | -8.2 | 32 |
| 5 | 65 | 26.8 | 130.4 | -4.4 | 29 |
| 6 | 271.0 | 6.4 | 68.7 | -6.1 | 35 |
| 7 | 132.0 | 13.2 | 89.7 | -1.7 | 32 |
| 8 | 200 | 8.7 | 72.5 | 4.6 | 26 |
| 9 | 249 | 7 | 87 | -5.7 | 34 |
| IO | 235 | 7.4 | 93.5 | -2.3 | 41 |
Table 1: Geometric characteristics of the simple circular ramps and number of collected observations.
| Ramp No- | Length of straight section -111 |
First curve radius -111 |
Degree of curvature of fi r.; t curve (degree) | Second curve radius -111 |
Degree of curvature of second curve (degree) | Grade (%) | No. of Observations |
|---|---|---|---|---|---|---|---|
| I | 229.0 | 236.0 | 7.4 | 55 | 31.8 | 4.3 | 33 |
| 2 | 100.0 | 80.0 | 21.8 | 300 | 5.8 | -2.8 | 33 |
| 3 | 117.0 | 268.0 | 6.5 | 52 | 33.6 | 4.1 | 30 |
| 4 | 210.0 | 205.0 | 8.5 | I 021.0 | 1.7 | - I.I | 32 |
| 5 | 109.0 | 280.0 | 6.2 | 35 | 49.9 | 7 | 37 |
| 6 | 50.0 | 46.0 | 38 | 444 | 3.9 | -3 | 33 |
| 7 | 112.0 | 295.0 | 5.9 | 192 | 9.1 | 1.6 | 39 |
| 8 | 98.0 | 176.0 | 9.9 | 158 | I I.I | -2.8 | 35 |
| 9 | 92.0 | 313.0 | 5.6 | 129 | 13.5 | 7.5 | 33 |
| 10 | 364.0 | 153.0 | 1 1.4 | 147 | 1 1.9 | -3.2 | 25 |
Table 2: Geometric characteristics of the curve -straight -curve ramps.
| Ramp No. | Ramp exit radius n) | Degree of curvature (degree) |
|---|---|---|
| I | 147.0 | 11.9 |
| 2 | 35.0 | 49.9 |
| 3 | 444.0 | 3.9 |
| 4 | 192.0 | 9.1 |
| 5 | 132.0 | 13.2 |
| 6 | 200.0 | 8.7 |
| 7 | 55 .0 | 31.8 |
| 8 | 300.0 | 5.8 |
| 9 | 1021.0 | 1.7 |
| 10 | 158.0 | 11.1 |
| 11 | 235.0 | 7.4 |
| 12 | 148.0 | 11.8 |
| 13 | 27 1.0 | 6.4 |
| 14 | 149.0 | 11.7 |
| 15 | 83.0 | 21.0 |
Table 3: Characteristics of the measured geometric variables for ramp exit.
Analysis and Results
Ramp proper capacity
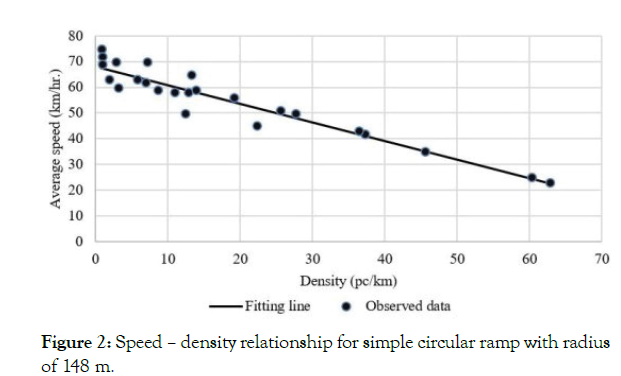
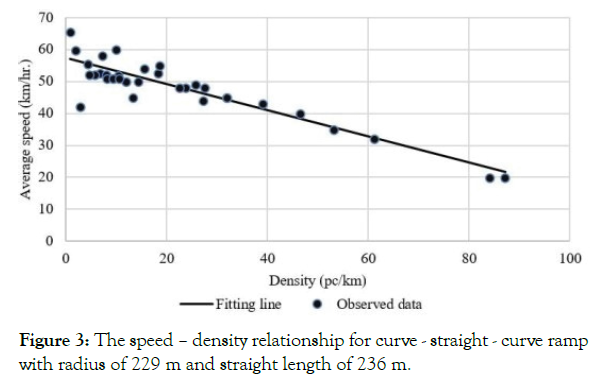
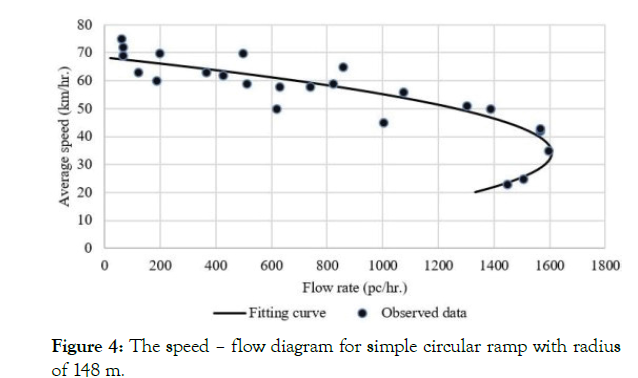
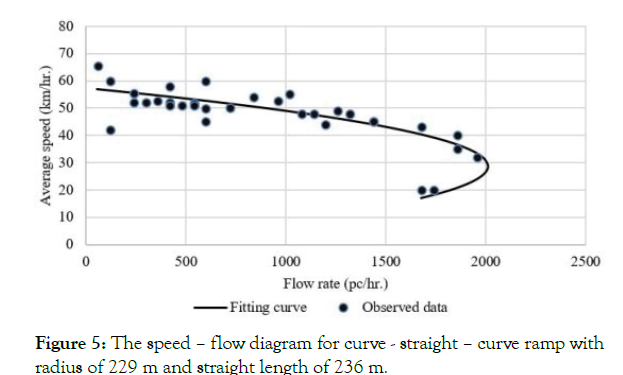
For ramp proper section, the data was analyzed in two steps. In the first step, both speed – density and speed – flow relationships were investigated. The traffic density was computed from the obtained field speed and flow data. Figures 2 and 3 shows the relationships between speed and density for circular and curve-straight-curve ramps, respectively. These figures illustrate that the relationship is linear. Furthermore, Figures 4 and 5 indicate that the relationship between speed and flow is parabolic for circular and curve-straightcurve ramps, respectively. Thus, this form is analogous to the Greenshields’ model [16,17], which has the following form:
 (1)
(1)
Where:
u: Traffic speed, km/hr.
uf: Free-flow speed.
kj: Jam density, pc/km.
k: Traffic density.
Figure 2: Speed – density relationship for simple circular ramp with radius of 148 m.
Figure 3:The speed – density relationship for curve - straight - curve ramp with radius of 229 m and straight length of 236 m.
Figure 4: The speed – flow diagram for simple circular ramp with radius of 148 m.
Figure 5: The speed – flow diagram for curve - straight – curve ramp with radius of 229 m and straight length of 236 m.
Tables 4 and 5 present the fitted regression relations between speed and density for each circular ramp and for each curve-straightcurve ramp, respectively. These tables show that the coefficients of determination are relatively large; and there is a justification to compute capacity based on this linear relationship. Therefore, the capacity of each ramp was identified and determined according to Greenshields’ model for each ramp. In fact, it was found that computed capacities were equal or very close to the ones obtained from empirical data.
| Ramp No. | Capacity (pc/hr.) | Uf | Uf kj |
R2 |
|---|---|---|---|---|
| 1 | 1607 | 68.221 | 0.724 | 0.908 |
| 2 | 1750 | 64.204 | 0.589 | 0.89 |
| 3 | 2084 | 61.181 | 0.449 | 0.832 |
| 4 | 143 1 | 47.674 | 0.397 | 0.821 |
| 5 | 1466 | 38.826 | 0.257 | 0.837 |
| 6 | 2004 | 58.372 | 0.425 | 0.785 |
| 7 | 1863 | 56.282 | 0.425 | 0.867 |
| 8 | 1915 | 59.352 | 0.46 | 0.864 |
| 9 | 1813 | 61.938 | 0.529 | 0.801 |
| 10 | 1972 | 69.87 | 0.6 19 | 0.846 |
Table 4: The fitted regression relations between speed and density for each circular ramp and for each curve-straight-curve ramp.
| Ramp No. | Capacity (pc/hr.) | Uf | Uf kj |
Rz |
|---|---|---|---|---|
| I | 2010 | 57.408 | 0.4 1 | 0.833 |
| 2 | 1925 | 54.871 | 0.39 1 | 0.853 |
| 3 | 1843 | 53.4 15 | 0.387 | 0.778 |
| 4 | 1983 | 58.806 | 0.436 | 0.791 |
| 5 | 1859 | 53.162 | 0.38 | 0.894 |
| 6 | 1457 | 63.5 1 | 0.692 | 0.851 |
| 7 | 1903 | 60.64 | 0.483 | 0.895 |
| 8 | 1946 | 59.911 | 0.46 1 | 0.834 |
| 9 | 1716 | 71.989 | 0.755 | 0.802 |
| 10 | 2 180 | 88.639 | 0.90 1 | 0.872 |
Table 5: Capacity of the curve-straight-curve ramp, fitted speed-density relation parameters, and the coefficient of simple determination for the fitted
relation.
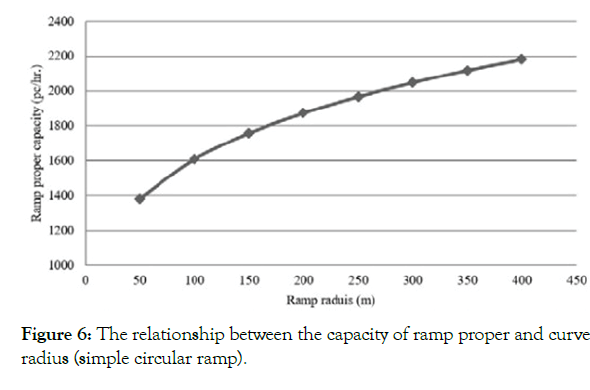
In the second step, the relationship between ramp capacity and geometric variables of ramps was explored using correlation and regression analysis. For circular ramp, the capacity was found to be positively correlated with ramp radius and free-flow speed and negatively correlated with intersecting angle and degree of curvature. Based on regression analysis, the following regression equation was developed to estimate capacity of circular ramps:
Cpc = 584×r0.22 (2)
where:
Cpc: The capacity of ramp proper for simple circular ramps (pc/ hr.). r: The ramp radius of simple circular ramp (m).
In the above equation, the coefficient of simple determination (R2) is 0.82, which indicates that large proportion of capacity variations can be explained by the circular curve radius. Using Equation (2), Figure 6 was drawn to show the relationship between proper capacity and ramp radius. As shown in Figure 6, the increase in radius from 50 to 100 m would increase capacity of ramp proper by 200 pc/hr. But, the increase in radius beyond 300 m has less incremental effect.
Figure 6: The relationship between the capacity of ramp proper and curve radius (simple circular ramp).
On the other hand, it was found that the capacity of curve-straightcurve ramp is positively correlated with the length of straight segment and negatively correlated with the degree of curvature of the first curve in the ramp. Based on regression analysis, the following equation was developed to estimate the ramp capacity:
 (3)
(3)
where:
Cpcsc: The capacity of ramp proper for curve – straight – curve ramps (pc/hr.).
DC F: The degree of curvature for the first curve of curve – straight – curve ramps (degree).
L: The length of straight segment (m), and
Ln: Natural logarithm.
For the above equation, the coefficient of multiple determinations R2 was 0.70. Also, this equation indicates that an increase in the straight segment length would increase the estimated proper capacity.
Ramp exit capacity
The data used in the ramp exit model consisted of 27 observations of at capacity on 15 ramp exit sections. Stepwise regression analysis was conducted to estimate the capacity at ramp exit as a function of traffic flow and average speed at outer two lanes in the mainline street and the degree of curvature for ramp in the exit section. A logarithmic relationship was obtained in the following form
 (4)
(4)
where:
Cexit: The capacity of ramp exit (pc/hr.).
Fm: The traffic volume on the outer two lanes in the mainline street,
(pc/hr.)
Sm: The average traffic speed on the outer two lanes in the mainline street, (km/hr.).
DC Ex: The degree of curvature for the curve at
ramp exit, degrees.
Discussion
In this study, ramp capacity models were estimated for proper and exit sections. Ramp proper capacity models were developed as a function of geometric design variables. In HCM (2010) ramp capacity is estimated according to ramp free-flow speed. For curve section, the American Association of State Highway and Transportation Officials, AASHTO [18,19] indicated that speed depends on geometric design variables such as curve radius. In this study the free-flow speed is correlated with geometric design variables, which have the greatest correlation with ramp capacity. Thus, for simple circular ramps, ramp radius has the greatest effect on ramp proper capacity. The relationship between capacity of simple circular ramp and ramp radius has a power form. The other measured variables have a strong multicollinearity with ramp radius, so that they were not included in the developed model.
For curve – straight - curve ramps, the degree of the first curve and the length of straight segment are the most geometric variables that influence ramp proper capacity. The ramp free-flow speed was not included in the developed model because it was positively correlated with straight segment length. Based on the developed Equation (3), Figure 6 shows the impact of the degree of curvature and length of straight segments on the ramp proper capacity of a curve – straight - curve ramps. As shown in the figure higher capacity would be obtained by increasing straight segment length. The increase in the degree of curvature has less effect on estimated capacity, especially if the degree of curve is more than 12 degrees.
In general, the maximum ramp capacity estimated in the HCM (2010) is 2200 pc/hr./lane at ramp free- flow speed of more than 80 km/hr. and the minimum capacity is 1800 pc/hr./lane at ramp free-flow speed of about 30 km/hr. Leisch [7] suggested that the ramp proper capacity for single lane ranged from a minimum of 1250 to maximum 1900 pc/hr. at ramp free-flow speed of about 30 km/hr. and 80 km/hr. or more, respectively. For simple circular ramp, this study indicated that the ramp proper capacity of single lane ranged from a minimum of 1470 pc/hr. to a maximum of about 2100 pc/hr. at ramp radius of 65 m and 300 m, respectively. While, ramp proper capacity for curve – straight - curve ramps ranged from a minimum of 1490 pc/hr. to a maximum of about 2200 pc/hr. at straight segment length of 50 and 360 m, respectively. Thus, this study revealed that ramp configuration has a significant impact on ramp proper capacity, and curve-straight-curve ramp has higher marginal capacity when compared with circular ramp. Also, this study pointed to the importance of customizing capacity values to reflect local conditions and drivers’ behavior. It is clear that the use of HCM values in Jordan would overestimate ramp capacity values, specifically for relatively small ramp radius.
For ramp exit, the analysis revealed that ramp exit capacity was significantly affected by vehicle speeds and traffic flows on the outer two lanes in the mainline street and the degree of curvature of ramp exit section. Using Equation (4), Table 6 shows the relationship between the ramp exit capacity and traffic flows on the outer two lanes in the mainline street with their average speeds in addition to the degree of curvature of ramp exit section. For flat exit ramp (degree of curve of 2 degrees), the capacity ranged from a minimum of nearly 1800 pc/hr. under high mainline speed (90 km/hr.) and heavy mainline traffic (1200 pc/hr. or more) to a maximum of about 1950 pc/hr. Under low mainline speed (45 km/hr.) and light mainline traffic condition (less than 1200 pc/ hr.).
Investigation of Tables 4, 5, and 6 indicated that ramp exit capacity determines the ramp capacity if the degree of curve is 12 degrees or more and the mainline traffic flow exceeds 1200 pc/hr., otherwise ramp proper controls the ramp capacity especially if the radius of circular ramp or first curve of curve- straight-curve is less than 60 m. Therefore; to increase the capacity of proper or exit ramps it is necessary to use curves with large radii at these locations.
| Average speed in the outer two lanes in the mainline (km/hr.) | Degree of c11T Curvature of rar np in exit section (degree) | Traffic volume in the outer two lanes in mainline street (pc/hr.) | ||||||
|---|---|---|---|---|---|---|---|---|
| 100 | 600 | 1 200 | 1800 | 2400 | 3000 | 3600 | ||
| 45 | 2 | 1976 | 1939 | 1925 | 1917 | 191 1 | 1906 | 1902 |
| 6 | 1826 | 1731 | 1 694 | 1672 | 1657 | 1645 | 1635 | |
| 12 | 1731 | 1599 | 1548 | 1518 | 1497 | 1480 | 1467 | |
| 24 | 1636 | 1467 | 1402 | 1364 | 1336 | 1315 | 1298 | |
| 40 | 1566 | 1370 | 1 294 | 1250 | 1218 | 1194 | 1174 | |
| 60 | 2 | 1%9 | 1929 | 1914 | 1905 | 1899 | 1894 | 1890 |
| 6 | 1807 | 1705 | 1665 | 1642 | 1625 | 1613 | 1602 | |
| 12 | 1705 | 1563 | 1 508 | 1476 | 1453 | 1435 | 1421 | |
| 24 | 1603 | 1422 | 1351 | 1310 | 128 1 | 1258 | 1240 | |
| 40 | 1528 | 1317 | 1236 | 1188 | 1 154 | 1 128 | 1106 | |
| 80 | 2 | 1962 | 1919 | 1903 | 1893 | 1886 | 1881 | 1877 |
| 6 | 1789 | 1679 | 1637 | 1612 | 1594 | 1581 | 1569 | |
| 12 | 1680 | 1528 | 1469 | 1434 | 1410 | 139 1 | 1375 | |
| 24 | 1571 | 1376 | 130 1 | 1257 | 1225 | 120 1 | 1181 | |
| 40 | 1490 | 1264 | I 177 | 1126 | 1090 | 106 1 | 1038 | |
| 90 | 2 | 1959 | 1915 | 1898 | 1888 | 1881 | 1 876 | 1872 |
| 6 | 1781 | 1669 | 1625 | 1599 | 1581 | 1 567 | 1556 | |
| 12 | 1669 | 1513 | 1452 | 1417 | 1392 | 1373 | 1357 | |
| 24 | 1557 | 1357 | 1280 | 1235 | 1203 | 1178 | 1157 | |
| 40 | 1475 | 1243 | 1153 | 1100 | 1063 | 1034 | 1011 | |
Table 6: Ramp exit capacity according to traffic/Online and vehicle speeds in the outer two lanes in main line street and degree of curvature of the exit
section.
Conclusion
Based on the results of this study, the following conclusions can be drawn:
• For the investigated circular and curve-straight-curve ramps, the study has confirmed that traffic speed on the proper is linearly related to traffic density.
• For circular ramps, the capacity of proper varied from 1470 to 2100 pc/hr., and the radius of the ramp is the most determinant factor. The obtained relationship between ramp capacity and the curve radius had a power form.
• Proper capacity of curve – straight – curve ramp was found to be significantly influenced by the length of straight segment and the degree of curvature of the first curve. The analysis revealed that the capacity varied from 1490 to 2200 pc/hr. Compared with proper of circular ramps, proper of the curve- straight-curve ramp had slightly higher capacity.
• Capacity of ramp exit section was significantly affected by traffic flow condition on the mainline street and the degree of curvature of ramp exit section. In general, the ramp exit capacity varied from about 1000 to 2000 pc/hr. under different traffic and geometric conditions. The results of this study indicated that ramp exit determines the ramp capacity if the degree of exit curve is 12 degrees or more and the mainline traffic flow exceed 1200 pc. /hr., otherwise, ramp proper determines the ramp capacity.
• Results of the study revealed the importance of customizing capacity values in other counties to reflect local conditions and provide more reasonable and accurate values.
Recommendations
It is recommended to conduct further studies to explore the impact of geometric design variables on the capacity of reverse-curve and directional ramps. Also, it is recommended to validate international manuals to account for local conditions.
REFERENCES
- Sun DJ, Liu X, Ni A, Peng C. Traffic congestion evaluation method for urban arterials: case study of Changzhou, China. Transp Res Rec. 2014;2461(1):9-15.
- Elefteriadou LA. The highway capacity manual 6th edition: A guide for multimodal mobility analysis. ITE Journal. 2016;86(4).
- Manual HC. Highway Capacity Manual, 2010. Proceedings of the Transportation Research Board, National Research Council, Washington, DC, USA. 2010;1207.
- Zhou R, Zhong L, Zhao N, Fang J, Chai H, Zhou J, et al. The development and practice of China highway capacity research. Transp Res Proc. 2016;15:14-25.
- Al-Kaisy A, Stewart JA, Aerde MV. A simulation approach for examining capacity and operational performance at freeway diverge areas. Can J Civ Eng. 1999;26(6):760-770.
- Ben-Edigbe J. Estimation of Midblock Median Opening U-Turn Roadway Capacity Based on Sectioning Method. Discrete Dyn Nat Soc. 2016;1:2016.
- Leisch JE. Capacity Analysis Techniques for design and operation of freeway facilities. Federal Highway Administration, Offices of Research and Development; 1974.
- Fang J, Han Y, Zhou Z. The Capacity of Urban Expressway Interchange. 11th International Conference of Chinese Transportation Professionals (ICCTP), 2011; p.2208-2216.
- Martinez MP, Garcia A, Moreno AT. Traffic microsimulation study to evaluate freeway exit ramps capacity. Procedia-Social and Behavioral Sciences. 2011;(16):139-150.
- Kondyli A, Gubbala P, Elefteriadou L. The contribution of ramp demand in the capacity of merge bottleneck locations. Transp Res Proc. 2016;(15):346-355.
- Al-Masaeid HR, Al-Omari BH, Al-Rhebh AM. Capacity of interchange outer connection ramps. Adv Transp Stud. 2019;1:49.
- Xue XJ, Shi F, Chen Q. Capacity estimation for on-ramp merging section of urban expressway based on time headway loss. Discrete Dyn Nat Soc. 2014 ;1:2014.
- Al-Masaeid HR, Al-Omari BH, Al-Rhebh AM. Capacity of interchange outer connection ramps. Adv Transp Stud. 2019 Nov 1;49.
- Al-Masaeid HR. Capacity of U-turn at median openings. ITE Journal. 1999 ;69(6):28
- Ullah I, Jamal A, Subhan F. Public perception of autonomous car: A case study for Pakistan. Adv Transp Stud. 2019;1:49.
- Seguin EL. Passenger car equivalents on urban freeways. US Federal Highway Administration, Offices of R and D; 1982.
- Greenshields BD, Bibbins JR, Channing WS, Miller HH. A study of traffic capacity. In Highway research board proceedings. Natl Acad Sci USA, HRB. 1935; (Vol. 1935).
- Ranney TA. Psychological factors that influence car-following and car-following model development. Transp Res F: Traffic Psychol Behav. 1999;2(4):213-219.
- Transportation Officials. A policy on geometric design of highways and streets. 2011. AASHTO; 2011.
Citation: Obeidat J (2021) Capacity of Interchange in Outer Connection Ramps. J Appl Mech Eng. 10:383.
Copyright: © 2021 Obeidat J. This is an open access article distributed under the term of the Creative Commons Attribution License, which permits unrestricted use, distribution, and reproduction in any medium, provided the original author and source are credited.
