Indexed In
- Online Access to Research in the Environment (OARE)
- Open J Gate
- Genamics JournalSeek
- JournalTOCs
- Scimago
- Ulrich's Periodicals Directory
- Access to Global Online Research in Agriculture (AGORA)
- Electronic Journals Library
- Centre for Agriculture and Biosciences International (CABI)
- RefSeek
- Directory of Research Journal Indexing (DRJI)
- Hamdard University
- EBSCO A-Z
- OCLC- WorldCat
- Scholarsteer
- SWB online catalog
- Virtual Library of Biology (vifabio)
- Publons
- MIAR
- University Grants Commission
- Euro Pub
- Google Scholar
Useful Links
Share This Page
Journal Flyer

Open Access Journals
- Agri and Aquaculture
- Biochemistry
- Bioinformatics & Systems Biology
- Business & Management
- Chemistry
- Clinical Sciences
- Engineering
- Food & Nutrition
- General Science
- Genetics & Molecular Biology
- Immunology & Microbiology
- Medical Sciences
- Neuroscience & Psychology
- Nursing & Health Care
- Pharmaceutical Sciences
Research - (2020) Volume 11, Issue 7
Assessment of Pond Productivity in African Catfish Farms
Lameck Deomedes*Received: 22-Jun-2020 Published: 20-Jul-2020, DOI: 10.35248/2155-9546.20.11.596
Abstract
The study was conducted in Coast region specifically in Kibaha, Kisarawe and Bagamoyo Districts. study aimed to determine water quality dynamics, pond characteristics and productivity; and nutritive values of feeds used in catfish farm. Water quality parameters was measured by water proof portable logging multi-parameter meter HANNA MODEL (H198194), feed samples were collected from catfish farmers and proximate analysis was conducted according to standard procedures given in Association of official Analytical Chemists (AOAC,1980), pond characteristics and productivity data were collected through self-administered questionnaires. Results indicated that Bagamoyo had highest temperature (29.94°C±1.70), pH (7.58±0.86) and DO (6.16ppm±0.76). Kisarawe showed highest TDS (1536.12ppm±2236.183) and Salinity (0.74±0.03), Kibaha indicated highest conductivity (1832/Ω/cm±60.69). The CP content was highest in feed sample A (32.96%) and lowest for feed sample E ( 16.85%), Feed C had highest crude fibre CF (11.04%) and sample A had lowest CF (0.36%). Feed A C had lowest EE (3.23%) and highest EE (9.76%) respectively. Highest and lowest fish yield, revenue and profit were recorded in Bagomoyo and Kibaha respectively, highest and lowest FCR were recorded in Kibaha (1.119) and Bagomoyo (0.794) respectively. The highest TDS was recorded in Kisarawe. Government should identify aquaculture zones, give subsidies to seed and feed manufactures so that farmers can incur little cost of production and impose inspections to feeds which are being manufactured.
Keywords
African catfish; Water quality parameters; Pond productivity; Fish feeds
Introduction
1950s, it has gone very far in 2006 to 51.7 millions tons [1]. The increase in human population and starving people especially in developing countries, have made the need of food production. Three main groups of activities that contribute to food production include agriculture, aquaculture and fisheries. Recent knowledge shows that the world’s stock of natural fish have finite production limits, therefore fish supply will mostly depend on aquaculture as cornerstone to remove the scarcity of fish resource [2]. The tradition and major source of fish globally is the capture fisheries; it is important to note that capture fisheries has remained stationary in some countries collapsed for instance Tanzania as a result of increase in population. The major hope of sustainability retaining this important fish diet in the global community is through aquaculture escalation. The level of aquaculture production globally remain imbalanced overs years across continents as well as countries with Asia accounting for over 89% of the world aquaculture production, the least developed countries mostly sub- Saharan countries remain very in significant in terms of the share of the world aquaculture, the major producers in Africa are Egypt, Nigeria and Uganda [3]. It is hoped that aquaculture production will increase fish supply and demand, currently aquaculture produces about 50% of the world supply of fisheries products for direct human use though the contribution of Aquaculture from Africa to the world aquaculture production was only 2.2% in 2010, due to the report from FAO of which 39.9% came from fresh water fish farming [4].
In Africa commercial African catfish farming is led by Nigeria and followed by Uganda [5]. African catfish is mostly cultured in earthen ponds, however, it can be culture in other systems such as tanks and hapas in the wild and riverine systems. Fish reproduces naturally but effort is required to induce spawning under culture conditions [6]. In Thailand, an integrated cage- cum-pond system, wastes from caged hybrid catfish have shown to be effective for producing phytoplankton to support Nile tilapia in the same pond [7]. Tanzania like other sub-saharan countries has identified aquaculture as an livelihood for earning income, the major problem with aquaculture in Tanzania most farmers have knowledge gap on how fish farming is conducted in a manner that can give them good yield, this knowledge gap is especially on the water quality dynamics, production costs and feed chemical composition.
They have been developed to meet the economic needs of the fish farmers and the requirements of the species to be cultured, the type of culture media used and their management have a significant influence on fish farm profitability. The most common production system in use is the earthen pond and has been in use since long time, the typical fish ponds are earthen enclosures in which fish live in a natural-like environment, feeding on natural food growing in the ponds [8].
In Tanzania catfish farming is basically done by various rearing facilities such as earthen ponds and concrete ponds. This study was undertaken to determine, water quality dynamics in fish ponds, pond characteristics and productivity, and quality of feeds used by catfish farmers. Most of the catfish farmers in Tanzania are not aware of the requirement of catfish in earthen ponds in terms of feed quality and water quality dynamics. Findings from this study provide baseline information on general management of catfish grow out and will be useful to the farmers and extension officers. It is envisaged that will be used to improve management of catfish rearing.
This will enhance a better fish growth and ultimately maximize their profit through aquaculture venture. The purpose of this study was to determine pond characteristic, feed nutritive values and productivity of catfish farms.
Material and Methods
Description of study area
The study was conducted in Coast region specifically for three districts which are Kibaha (Latitude 06°42′47.45.25″S and Longitude 038° 45′58.9″E), Bagamoyo (Latitude 06° 32′31.8″S and Longitude 038° 32′31.8”E); Kisarawe (Latitude 06°5531.0” S and 039° 53’ 47.7”E). Coast Region is one of Tanzania's 30 administrative regions. The regional capital is Kibaha. According to the 2012 national census, the region had a population of 1,098,668, which was slightly lower than the pre-census projection of 1,110,917. From 2002 to 2012, the region's 2.2 percent average annual population growth rate was the 17th highest in the country. It was also the 21st most densely populated region with 34 people per square kilometer. With a size of 32,407 square kilometers (12,512 sq-mi), the region is slightly larger than the U.S. state of Maryland (32,133 square kilometers (12,407 sq-mi)). The region is bordered to the north by the Tanga Region, to the east by the Dar es Salaam Region and the Indian Ocean, to the south by the Lindi Region, and to the west by the Morogoro Region (Figure 1).
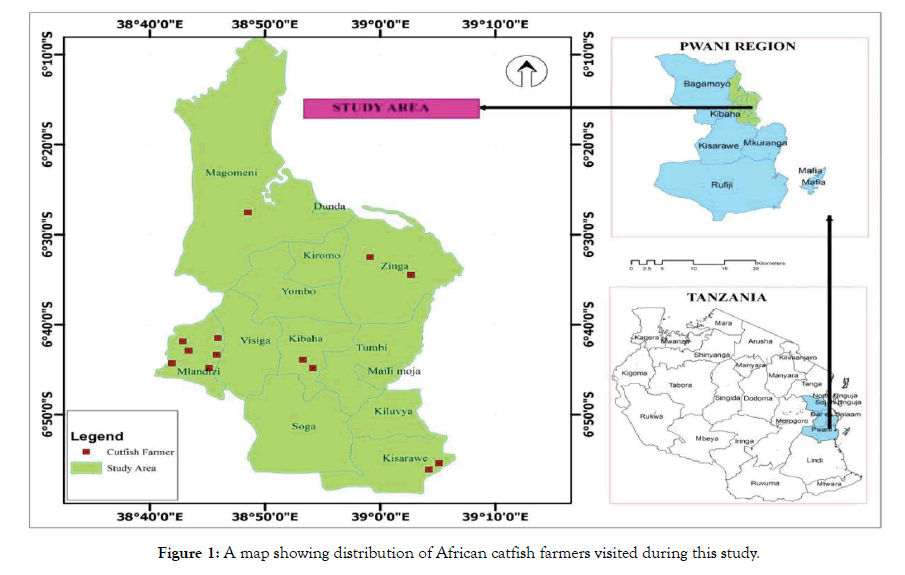
Figure 1: A map showing distribution of African catfish farmers visited during this study.
Data collection
Pond characteristics and productivity: Pond characteristics such as size, depth, stocking density and general production information were collected by using questionnaires prepared before field work. Information collected using questionnaires were pond size.
Water quality parameters
Water quality parameters were measured by water proof portable logging multi-parameter meter HANNA MODEL (HI98194). Five different water quality parameters were recorded during this study. These parameters were pH, salinity (PSU), Conductivity (μs/cm), Dissolved Oxygen (mg/l)), Total Dissolved solids (TDS) and Temperature (°C).
Determination of nutritive value of feeds
Feed samples from feeds used in catfish farms were collected. Samples collected were finely grounded by a laboratory grinding machine found at the Department of Animal, Aquaculture and Range Sciences and kept in airtight container for subsequent chemical analysis which was done for several days. Feed samples collected were in a form of pellets and mash.
Analytical methods
The proximate composition of different fish feed samples were analysed according to standard procedures given in Association of Official Analytical Chemists (AOAC, 1980). Moisture was determined by keeping 3 g of the feed samples in a thermostat oven at 105°C for 24 h. The difference between the initial weight and final weight gave the moisture content.
For determination of crude protein, samples (3 g) were digested in digestion unit (Digester, Model 2020) for 45 min. The digester was then distilled in distillation unit. Finally; it was titrated with 0.2 N HCL and crude protein was obtained by multiplying the total nitrogen by a conversion factor of 6.25.
Crude lipid: Crude lipid was determined by extracting a weighed quantity of sample with acetone in Sechelt Extraction Unit (model 1045).
Ash: Ash content was determined by igniting feed samples in a muffle furnace at 450°C overnight.
Crude fibre: Samples (3 g) were digested with 0.128 M H2SO4 with few drops of octane in digestion unit for 30 min, then washed in boiling water and acetone. The residues was dried in an oven at 130°C for 2 h and ignited in muffle furnace at 500°C for 3 h. The loss of weight represented the crude fibre.
Statistical analysis
Data were analysed by using SPSS software version 20. One way ANOVA was used to determine differences in water quality parameters in fishponds among the three studies sites. Descriptive statistic was used to compute the means and standard deviation. The post hoc test, (Turkey HSD) test was used to compare the means. The hypotheses were tested at 5% level of significance.
Results
Catfish farm characteristics and productivity
The farm characteristics and productivity of catfish farmingin Kibaha, Kisarawe and Bagamoyo are summarized in Table 1. Ponds with the largest and smallest size (ha) were observed in Bagamoyo (0.0953ha) and Kisarawe (0.0531ha) respectively. However, there was no significant difference among the three studied sites (P>0.05). Likewise the highest and lowest stocking density were recorded in Bagamoyo (60000 fingerlings/ha) and Kisarawe (46250 fingerlings/ha) respectively and there was no significant difference among the locations in (P>0.05). Amount of feed used by farmers for a duration of six month was higher in Bagamoyo compared to Kibaha and Kisarawe (Table 1). There was significant difference in the amount used among the three Districts (P<0.05). Fish production was estimated from all studied sites and it was observed that the highest and lowest was obtained from Bagamoyo (21.00 tan/ha) and Kibaha (15.67 tan/ha) respectively. Statistically there was no significant difference in total fish production among the three sites (P>0.05). There was significant higher total cost of production in Bagamoyo (8.64 million TSH) compared to other sites (P<0.05). The highest revenue and profit were recorded in Bagamoyo with significant difference only in revenue (P<0.05). The lowest Feed Conversion Ratio (FCR) was obtained from Kisarawe (0.794) but there was no significant difference among the three Districts (P>0.05).
| Items | Kibaha | Kisarawe | Bagamoyo |
|---|---|---|---|
| Pond size (ha) | 0.0681 ± 0.0597a | 0.0531a ± 0.0107 | 0.0953 a ± 0.0820 |
| Fish stocking (fish/ha) | 54932 a ± 13796 | 46250a ± 9161 | 60000 a ± 23094 |
| Feed consumption (tan) | 0.899a ± 0.710 | 0.587b ± 0.136 | 0.1969 c ± 0.1832 |
| Total harvest (tan/ha) | 15.67a ± 5.53 | 16.19a ± 3.21 | 21.00 a ± 8.08 |
| Fish revenue (M Tsh) | 6.02a ± 1.45 | 5.09b ± 3.94 | 11.5 c ± 3.46 |
| Total cost (M Tsh) | 4.41a ± 8.78 | 2.98b ± 1.95 | 8.64 c ± 2.88 |
| Profit (M Tsh) | 1687850 ± 725030a | 2636000a ± 307462 | 2822864a ± 787062 |
| FCR | 1.12a ± 0.10 | 0 .79 a ± 0.11 | 1.05 a ± 0.12 |
Means with same superscript letters in the rows are not significantly different (LSD, P>0.05); Feed consumption and Total cost were significantly different from zero at P<0.05
Table 1: Characteristics of Catfish farming in the study area by farm location.
Water quality parameters
The water quality parameters recorded from fish farmers in Kibaha, Bagamoyo and Kisarawe are given in Table 2. Bagamoyo had a significant higher mean temperature (29.9372°C) compared to Kisarawe (25.8162°C) and Kibaha (28.3491°C) (P<0.05). There was no significant difference in mean pH between Kibaha and Kisarawe (P>0.05) but in Kisarawe and Bagamoyo there was significant difference. There was no significantly difference in mean Dissolved Oxygen (DO) between Kibaha and Bagamoyo (P>0.05), but there a significant difference (P<0.05) among ponds found in Kibaha, Bagamoyo and Kisarawe. TDS (Total Dissolved Solids) for Kibaha and Bagamoyo were within recommended standard while for Kisarawe it was above the recommended standard. In all three Districts there was no significantly different in TDS (P>0.05). There was no significantly different in Salinity among the studied sites (P >0.05). Kibaha had higher Conductivity compared to other two Districts. However, there was no significantly different in conductivity in all three Districts (P>0.05).
| Parameters | Location | Mean ± SD | Ranges |
|---|---|---|---|
| Temperature (°C) | Kibaha | 28.3491 ± 1.11936a | 26.42-30.10 |
| Kisarawe | 25.8162 ± 0.86320b | 25.05-27.78 | |
| Bagamoyo | 29.9372 ± 1.70036c | 26.93-32.71 | |
| pH | Kibaha | 6.9138 ± 0.60451a | 5.20-8.01 |
| Kisarawe | 6.5425 ± 0.22410a | 6.23-6.97 | |
| Bagamoyo | 7.5806 ± 0.86526b | 6.43-9.28 | |
| Dissolved oxygen (mg/l) | Kibaha | 5.4861 ± 0.42208a | 4.92-6.30 |
| Kisarawe | 5.6171 ± 0.15446a | 5.45-5.80 | |
| Bagamoyo | 6.1594 ± 0.76349a | 4.97-7.19 | |
| Total dissolved solids (mg/l) | Kibaha | 917.70 ± 842.814a | 46- 2527 |
| Kisarawe | 1536.1 ± 2236.18a | 687-7070 | |
| Bagamoyo | 599.50 ± 429.188a | 72- 1203 | |
| Salinity (PSU) | Kibaha | 1.0093 ± 0.89470a | 0.00-2.69 |
| Kisarawe | 0.7400 ± 0.02777a | 0.69-0.77 | |
| Bagamoyo | 0.5983 ± 0.43846a | 0.07-1.22 | |
| Conductivity (µS/cm | Kibaha | 1837.2 ± 1606.99a | 91-5050 |
| Kisarawe | 1481.88 ± 60.690a | 1373-1550 | |
| Bagamoyo | 1204.11 ± 862.31a | 144-2405 |
Means with different superscript letters within a column indicate significant differences
(Turkey, P<0.05);TDS (ppm), PSU and Conductivity (µ/Ω/cm) were not significantly different from zero at P>0.05 * =P< 0.05
Table 2: Summary of water quality parameter recorded in fish ponds during the study.
Feed proximate composition
The results of chemical composition of different feed samples collected from catfish farmers are shown in Table 3. In all feed samples proximate composition were within the recommended standards except for crude protein for feeds B, C and E which were not in recommended standard (Figures 2-4).
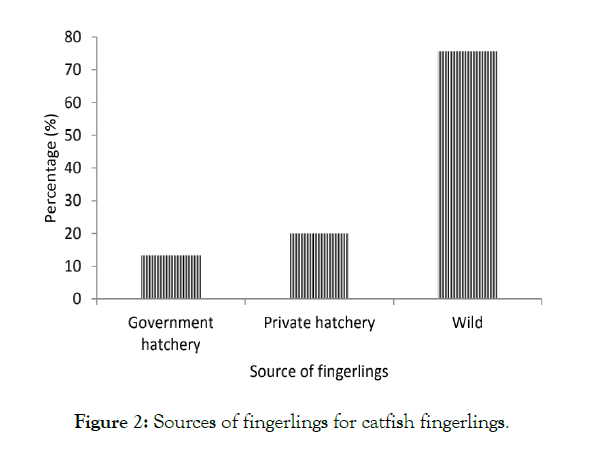
Figure 3: Sources of fingerlings for catfish fingerlings.
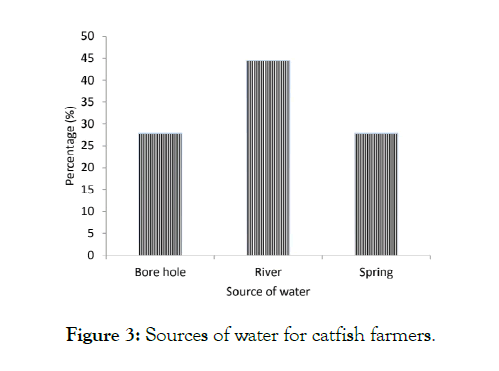
Figure 4: Sources of water for catfish farmers.
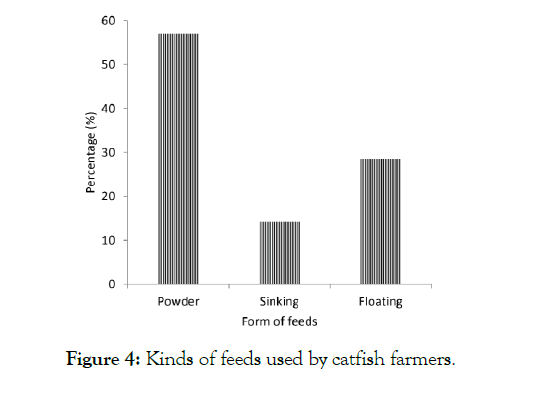
Figure 5: Kinds of feeds used by catfish farmers.
| Feed samples | Moisture | Crude protein (CP) | Crude fibre (CF) | Ether extract (EE) | Ash |
|---|---|---|---|---|---|
| Sample A | 4.61 | 32.96 | 0.36 | 3.23 | 6.60 |
| Sample B | 2.27 | 19.72 | 6.45 | 7.22 | 20.44 |
| Sample C | 3.15 | 18.36 | 11.04 | 9.76 | 10.89 |
| Sample D | 3.65 | 30.53 | 4.77 | 4.49 | 11.69 |
| Sample E | 3.08 | 16.85 | 5.06 | 4.69 | 8.59 |
Table 3: Nutritive value of feeds used in catfish grows out farms.
Discussion
Pond characteristics, management and productivity
The highest number of fingerlings stocked in Bagamoyo is probably due to the fact that most the ponds were large in size compared to other districts. The highest tans of feeds consumed for duration of six months, this is also answered by the same reason as for stocking. The highest harvest in comparison to all other Districts this is also supported by pond sizes which were found in Bagomoyo. The highest total cost of production this is due to the fact that stocking density of fingerling was high this could have caused high cost of production in terms of purchasing feeds and seeds. Bagamoyo had highest fish revenue in comparison to other District, also this is answered by the reason of investment cost. In all three Districts FCR were within the recommended standard. Pond characteristics and productivity is supported by Ali et al. [9].
Water quality dynamics
Kibaha recorded lowest range of dissolved oxygen among the three districts due to the fact that most of ponds visited highly turbid in comparison to the rest of districts. In all three districts dissolved oxygen were within the recommended ranges [10-12]. In all sites temperature fall within the recommended range for Catfish farming, Temperature in Kisarawe was recorded in the morning, hence slightly low compared to other Districts. Results obtained in this study is in agreement with Zakas. Bagamoyo recorded highest pH with respect to other Districts due to the fact that most farmers were using lime in their farms. These findings are in agreements with previous studies as shown by Zakas et al., Bhatnagar & Devin et al., Razzaque et al. and Nahar et al. [13-15]. WKisarawe recorded the highest TDS in compared to other Districts; this might be due to agricultural and industrial activities which currently taking place around Catfish farms could have caused deposition of silts in the farm, hence high TDS or might be due to nature of the soil were catfish farms were located for instance for clay soil water color might change to grey. In all three District TDS was not in recommended standard as reported by (PHILMINAQ 2014). Conductivity ideal for pond fish culture ranges between 30-5000 m Siemens/cm [16]. In the present study highest conductivity was recorded in Kisarawe and this is due to the fact that most of the farms visited were highly fertilized hence this could have caused increase of ions in water and hence highest conductivity, the conductivity reported in this study is in agreements with previous studies.
Nutritive value of feeds
Nutritive values of feeds collected from farmers were within recommended standard [14,17] with exception for Crude protein, in feeds B, C and E; this could be due to lack of awareness among farmers especially in ingredients composition of feeds which they buy from aqua-feed manufacturing companies or technical knowhow in the aspect of feed formulation.
Conclusion and Recommendations
The following conclusion can be drawn from the present study
1. In all three districts water quality parameters were within the recommended range except for TDS in Kisarawe.
2. Feed and seed costs have been observed to be very expensive in terms of total cost of production.
3. Feed proximate compositions which in feed samples collected from farmers were in a recommended standard for culturing African catfish, except for Crude protein this is more specific in crude protein composition among all feed samples non has recommended standard for African catfish.
4. Major source of seeds and water are from the wild and rivers respectively, meanwhile feeds used mostly are in powder form
5. Fisheries officers and research institute should help farmers to identify better site for fish farming so that to avoid conflicts which may arise between fish farmers and other activities such as Agriculture and Industrial activities, as it has been found that in Kisarawe District pond water had higher TDS than normal due to industrial and Agriculture activities taking place which have caused conflicts.
6. Government should provide subsidies to feed and seed manufactures so that farmers can buy feeds at reasonable price which can be afforded by small scale farm
REFERENCES
- Interdonato F. Recirculating aquaculture system (RAS) biofilters: focusing on bacterial communities complexity and activity. 2012; 124.
- Basin V. Profitability assessment : A case study of African catfish (clarias gariepinus) farming in the lake Victoria. Project report. 2004; 36.
- Tibihika PD, Barekye A, Byakora E. Critical analysis of the growth performance of three fish species; Mirror carp (Cyprinus carpio), Nile tilapia (Oreochromis niloticus) and Sharp toothed African catfish (Clarias gariepinus), cultured in earthen ponds in Kigezi region South-western. International Journal of Fisheries and Aquatic Studies. 2015; 2: 63-73.
- Crop A. Performance of locally formulated feeds for rearing of African catfish in Tanzania. African Crop Science Journal. 2014; 22: 979-986.
- Dasuki A, Auta J, Oniye SJ. Effect of stocking density on production of Clarias gariepinus (Tuegels) in floating bamboo cages at Kubanni reservior, Zaria, Nigeria. Bayero Journal of Pure and Applied Sciences. 2013; 6: 112-117.
- Amisah S, Oteng MA, Ofori JK. Growth performance of the African catfish, Clarias gariepinus, fed varying inclusion levels of Leucaena leucocephala leaf meal. J. Appl. Sci. Environ. Manage. 2009; 13: 21-26.
- Yi Y, Lin CK, Diana JS. Hybrid catfish (Clarias macrocephalus x C. gariepinus) and Nile tilapia (Oreochromis niloticus) culture in an integrated pen-cum-pond system: growth performance and nutrient budgets. Aquaculture. 2003; 217: 395-408.
- lopade OA, Gbaramana M, Zabbey N. Estimation of Length-Weight Relationship and Proximate Composition of Catfish ( Clarias gariepinus Burchell , 1822) from Two Different Culture Facilities. Turkish Journal of Agriculture - Food Science and Technology. 2015; 3: 566-570.
- Ali H, Haque MM, Belton B. Striped catfish (Pangasianodon hypophthalmus, Sauvage, 1878) aquaculture in Bangladesh: an overview. Aquaculture Research. 2013; 950-965.
- Philminaq S. Water Quality Criteria and Standards for Freshwater and Marine Aquaculture . Mitigating impact from Aquaculture in the Philippines. 2014; 34.
- Razzaque M. Culture possibility of scheilbeid catfish using formulated feed in natural pond. J. Bangladesh Agri Univ. 2008; 6: 375-380.
- Zakas NC. Water Quality and General Pond. African Journal of Agricultural Research. 2013; 70-96.
- Bhatnagar A, Devi P. Water quality guidelines for the management of pond fish culture. International Journal of Environmental Sciences. 2013; 3: 1980-2009.
- Nahar Z. Effect of different feeds on growth, survival and production of African catfish (Clarias gariepinus Burchell). Bangladesh J Fish Res. 2000; 4: 121-126.
- Ayuba VO, Iorkohol EK. feed proximate composition. Journal of Fisheries and Aquatic Science. 2013.
- Bregnballe J. A Guide to Recirculation Aquaculture. FAO and Eurofish Report. 2015; 100.
- Umaru J. Growth and economic performance of African catfish, Clarias gariepinus (Burchell, 1822) Juveniles to imported and local feeds in floating bamboo cages. International Journal of Fisheries and Aquatic Studies 2016; 4: 221-226.
Citation: Deomedes L. Assessment of Pond Productivity in African Catfish Farms. J Aquac Res Development 11: 7.
Copyright: ©: 2020 Deomedes L. This is an open access article distributed under the term of the Creative Commons Attribution License, which permits unrestricted use, distribution and reproduction in any medium, provided the original work is properly cited.
