Indexed In
- Open J Gate
- RefSeek
- Hamdard University
- EBSCO A-Z
- OCLC- WorldCat
- Publons
- International Scientific Indexing
- Euro Pub
- Google Scholar
Useful Links
Share This Page
Journal Flyer

Open Access Journals
- Agri and Aquaculture
- Biochemistry
- Bioinformatics & Systems Biology
- Business & Management
- Chemistry
- Clinical Sciences
- Engineering
- Food & Nutrition
- General Science
- Genetics & Molecular Biology
- Immunology & Microbiology
- Medical Sciences
- Neuroscience & Psychology
- Nursing & Health Care
- Pharmaceutical Sciences
Research Article - (2025) Volume 14, Issue 1
Assessment of Land Use and Land Cover Change Using GIS and Remote Sensing Techniques around Metu District, South Western Ethiopia
Bezabih Adisu*Received: 20-Jun-2023, Manuscript No. JGRS-23-21916; Editor assigned: 22-Jun-2023, Pre QC No. JGRS-23-21916 (PQ); Reviewed: 06-Jul-2023, QC No. JGRS-23-21916; Revised: 05-Jan-2025, Manuscript No. JGRS-23-21916 (R); Published: 12-Jan-2025, DOI: 10.35248/2469-4134.25.14.368
Abstract
The surface of the Earth is undergoing rapid land use and land cover changes due to various socioeconomic activities and natural phenomena. Land use and land cover changes that occurred from 2000 to 2020 in Metu area were monitored using remote sensing and geographic information system with field verifications. The objective of this study is to understand the dynamics of land use and land cover and analyze change detection around Metu area over a period of 21 years. Satellite images of landsat 7 ETM+ and LANDSAT 8 ETM+ were used. All images were classified using object-based image classification technique. Accuracy assessments were conducted for each reference year. Four LULC’s were successfully captured viz. Built up areas, water bodies, forests and croplands with overall accuracies for 2000 and 2020 image classification accuracy were 61% and 80.7% and kappa coefficient were 0.5 and 0.8 respectively. Change detection analysis was performed to compare the quantities of land cover class conversions between time intervals. The results revealed both increase and decrease of the different LULC classes from 2000 through to 2020. Significant shifts from some classes to others were observed. The classification result revealed that forest cover (45.71%) and cropland (43.19%) were dominant LULC types in 2000. In 2020, cropland (53.02%) was the major LULC types followed by forest cover (28.36%); buildup area (15.78%) and water body (2.84%). The change result shows that a significant conversions from one land cover category to another within the same period. There were significant conversions from forest cover to crop land (40.5%), crop lands to build up area (17.6%). Drivers of the observed changes may be due to natural phenomena and socio-economic activities. Consistent LULC mapping should be carried out in order to quantify and characterize LULC changes. This will help establish trends and enable resource managers to project realistic change scenarios helpful for natural resource management.
Keywords
Land use/Land cover change; GIS and RS; Supervised classification; Satellite images
Introduction
Land is a vital resource and the basis of the existence of mankind and management of this resource including its conservation and utilization is of crucial importance. Land cover refers to the physical and biological cover over the surface of a land, while land use is the human use of a land for different activities. Land Use and Land Cover Change (LULCC) is the term used for the human modification of the earth terrestrial surface as a result of the different human activities [1]. LULC change is a major issue of concern with regards to change in the global environment.
The rapid growth and expansion of urban, rapid population growth, scarcity of land, the need for more production, changing technologies are among the many drivers of LULCC in the world today [2].
Many researchers argue that LULCC emerged as a major aspect in the wider debate of global change and that change originates from human-induced impacts on the environment and their implications for climate change [3]. The indicators of these changes can be clearly seen in the current major global concerns such as increasing concentrations of Carbon Dioxide (CO2) in the atmosphere, loss of biological diversity, conversion and fragmentation of natural vegetation areas and accelerated emission of greenhouses gases. LULCC can potentially affect regional and global, from local to global scales, land resources play critical roles in human livelihoods, as well as in ecosystem functioning and health [4].
Understanding the condition and changes through time of land resources such as forests is important in addition to the other. Accurate information on LULCC is critical for understanding the causes of change and for developing effective policies and strategies to slow and reverse land degradation [5]. Land use and land cover change has direct implications to achieve the sustainable development goals and to implement the actions required to combat climate change [6]. Recognizing the causes of LULCC requires understanding of three key issues: How people make land-use decisions; how specific socio-environmental factors interact to influence these decisions, and how farmers perceived the changes; and finally, land use decisions are made and influenced by socio-environmental factors across a wide range of spatial scales, from household level decisions that influence local land use practices, to policies and economic forces that can alter land use regionally and even globally [7]. Ethiopia is experiencing huge LULC dynamics mainly from natural vegetation to farming practices and human settlement. The land cover dynamics is more severe in the highlands because of higher population density and persistent agricultural activities for millennia compared to lowlands. The speed and scale of the change, irrespective of the efforts done by different stakeholders on conservation actions, has been accelerated in the last 2-3 decades of the 21st century [8]. As a result, the shortage of arable land has led to expansion of cultivation into deforestation and decline of grassland as a result of overgrazing, charcoal burning and other unsustainable land uses [9].
According to Mekonnen, et al. in the period 1986-2016 in Ethiopia, agriculture and settlement areas have increased by 250% and 618%, respectively [10]. On the other hand, forests and woodlands have decreased by 72% and 84%, respectively. Different causes have played roles in the dynamics of LULCC. The results showed that vegetation dynamics vary both spatially and temporally against precipitation and temperature. Similarly, Kindu, et al. reported that in the landscape of Munessa- Shashemene area of the Ethiopian highlands, LULC changes have occurred in the last four decades. The result revealed that grasslands (42.3%), natural forests (21%), and woodlands (11.4%) were dominant LULC types in 1973. The change result shows that a rapid reduction in woodland cover of 81.8%, 52.3%, and 36.1% occurred between the first (1973–1986), second (1986–2000), and third (2000–2012) study periods, respectively. Similarly, natural forests cover decreased by 26.1% during the first, 21.1% during the second and 24.4% during the third periods. Grasslands also declined by 11.9, 17.5, and 21.1% during the three periods, respectively. On the contrary, croplands increased in all three periods by 131, 31.5, and 22.7%, respectively. The main aim of this study is to identify the range of land use/land cover that contributes to the variation of different land-use classifications of Metu district; furthermore, this study uses as a reference for environmental experts around the area.
Objectives
General objective
• To examine the current land use land cover of Metu district, south western Ethiopia by using GIS and remote sensing.
Specific objective
• To understand the dynamics of land use and land cover changes at Metu district, south western Ethiopia over the period of 2000-2020
• To analyze change detection at Metu district, south western Ethiopia over the period of 2000-2020.
Materials and Methods
Study area
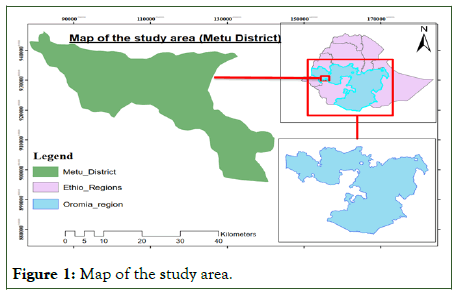
The research was conducted in Metu district in Ilu Abba Boor Zone, Oromia region of south western Ethiopia, which is located at an altitude of 1540 meter above sea level and at latitude of 8°17'46.13"N and 35°34'55.92"E longitude in Ethiopia. The study area is located at about 600 kilometers away from Addis Ababa, capital city of Ethiopia. Metu has a relatively cool tropical monsoon climate under the Köppen climate classification. It features a long annual wet season from April to October. Temperatures also a comfortable range, with the daily mean staying between 20°C and 25°C year-round.
Data collection and analysis
Two types of data were used in this research. Landsat 7 imagery (Year 2000) and landsat 8 imagery (Year 2020) were downloaded free of charge from the United States Geological Survey (USGS) via http://earthexplorer.usgs.gov/. Two acquisition years were acquired for the months of March-June. Selection of appropriate image acquisition dates is a precondition for clear identification of the LULC types from satellite imageries [11]. As such, in this study, image acquisition dates were selected based on availability of cloud free images in the months of the dry season. The ground truth data was in the form of reference points collected using Google earth for both year images analysis, used for overall accuracy assessment of the classification results. It was used to prepare the current land use/cover map of the study area through ERDAS imagine 2015 image processing software and Microsoft excel also used for change detection.
Pre-processing of satellite image
Digital image processing allows enhancing image features of interest while attenuating detail irrelevant to a given application and then extracting useful information about the scene from the enhanced image. Pre-processing of satellite images before detection of changes is a very vital procedure and has a unique aim of building a more direct association between the biophysical phenomena on the ground and the acquired data [12]. Data were preprocessed in ERDAS imagine 2015 was used to calibrate the layer stacking, resolution merge (Landsat 8 imagery), mosaicking and sub-setting of the image on the basis of Area of Interest (AOI).
Land use/cover classification and land use classes/ definitions
For this study, only supervised classification was performed. Supervised classification according to Eastman is where “the user develops the spectral signatures of known categories, such as Buildup area, forest etc. and then the software assigns each pixel in the image to the cover type to which its signature is most comparable” [13]. Supervised classification is the process most frequently used for quantitative analyses of remote sensing image data. The supervised classification was applied after defined Area of Interest (AOI) which is called training classes. More than one training area was used to represent a particular class. The basic sequence operations followed on supervised classification were;
Defining of training sites: The first step in undertaking a supervised classification is to define the areas that will be used as training sites for each land cover class. Training fields to be taken from maps and superimposed over the image data. The created features are called Area of Interest (AOI). The selection of the training sites was based on those areas clearly identified in all sources of images.
Extraction of signatures: After the training site (AOI) being digitized, the next step was to create statistical characterizations of information. These are called signatures editors in ERDAS imagine 2015. In this step, the goal was to create a signal (SIG) file for every informational class. The SIG files contain a variety of information about the land cover classes described. After the entire signature had been created then the SIG file saved as dialog. For each of the predetermined LULC type, training samples were selected by delineating polygons around representative sites. Spectral signatures for the respective LULC types derived from the satellite imagery were recorded by using the pixels enclosed by these polygons. The number of training sites varied from one LULC class to another depending on ease of identification and the level of variability.
Supervised classification of the image: The supervised classification has been applied after defined training classes. One or more than one training area was used to represent a particular class. During the supervised classification process, the entire signature editor was selected in order to be used on the classification process. Image classifications was performed using signatures developed from 100 training sample points collected for each of the identified land cover classes which is enough regarding the extent of the area. This study used the ERDAS image supervised classification maximum likelihood method to identify land cover using multispectral satellite data, which is one of the most popular and widely used types of image classification techniques. This was done on the basis of reflectance characteristics of the different LULC types [14].
From visual and digital interpretations of the satellite imagery, different LULC categories were distinguished, so that it will be possible to investigate changes that occurred. Based on the 2000/2020 satellite imagery, the land cover classes analyzed for changes were: Buildup area, water body, forest cover and crop land (Table 1).
| Land cover | General description |
|---|---|
| Buildup area | Included in this category are cities, towns’ villages, transportation, power and communications and utilities, and areas such as those occupied by shopping centers, industrial and commercial complexes, and institutions that isolated from urban areas. |
| Water body | Area occupied by major rivers of perennial or intermittent, lakes, ponds, stream, canal and reservoirs |
| Forest cover | A land spanning at least 0.5 ha covered by trees, attaining a height of at least 2 m and a canopy cover of at least 20% or trees with the potential to reach these thresholds. Deciduous forest, evergreen forest land and mixed forest land are included. |
| Crop land | Arable and fallow land that grow annual crops (wheat, maize, sorghum, ‘teff’, Cotton, horticultural crops etc.) or perennial crops (sugar cane, ‘enset’, coffee and permanent fruit trees) on the small scale or commercial level. Areas of land prepared for growing crops. Generally, this category includes areas currently under crop, fallow and land under preparation. |
Table 1: Description of the land use/land cover classes.
Accuracy assessment and change detection
If the classification data are to be useful in detection of change analysis, it is essential to perform accuracy assessment for individual classification. Accuracy assessment is an essential and crucial part of studying image classification and thus LULCC detection in order to understand and estimate the changes accurately. The classified output by comparing the true identity of land cover derived from reference data (observed) vs. the classified (predicted) for a random sample of pixels. It is important to be able to derive accuracy for individual classification if the resulting data are to be useful in change detection analysis [15]. All accuracy assessments include three fundamental steps: Designing the accuracy assessment sample, collecting data for each sample and analyzing the results.
First, the accuracy assessment sampling procedures are designed, and the sample areas on the map are selected. Second, information is collected from both the map and the reference data for each sample site. Accuracy assessment was done using the remaining 100 sample points which were not used for signature development. After collected reference data, it is represented through an error matrix. Error matrix are very effective representations of map accuracy because the individual accuracies of each map category are plainly described along with both the errors of inclusion (commission errors) and errors of exclusion (omission errors) present in the map. Confusion matrix was retrieved and producers and users accuracies and Kappa statistic were calculated from the error matrix. Proper use of the error matrix includes correctly sampling the map and rigorously analyzing the matrix results.
Change-detection analysis provides information about the changes in different seasons or dates. The information is extracted by comparing two or more images of an area that were acquired at different times. Change analysis was conducted using post-classification change detection technique following the classification of the imageries. Change statistics were computed by comparing image values of one dataset with the corresponding value of the second data set in each period.
The basic sequence operations followed on change-detection analysis were:
• Add classified satellite images: The first step in undertaking a change-detection is to add both classified images (2000 and 2020 images).
• Convert raster image to polygon types: The next step was to created polygon types of data by using conversion tools in ArcToolbox.
• Merge several features into single feature to classes using dissolve tools.
• Add new two fields such as class and area name (done the same producer for other image).
• Now create changes between years using intersect of geoprocessing tools.
• Open attribute under intersect and add new two fields such as change (Field calculate) and area change (calculate geometry).
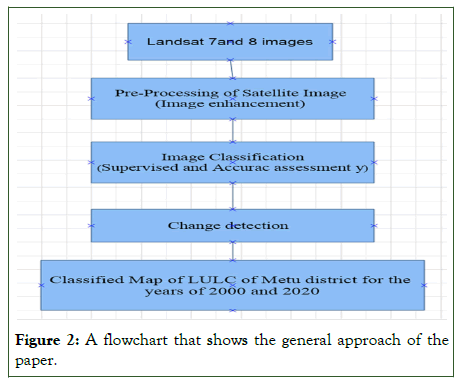
• Now I got features that were one class in the former years but changes to another class in the later (Figure 2).
Figure 1: Map of the study area.
Figure 2: A flowchart that shows the general approach of the paper.
Results and Discussion
Classification of satellites image
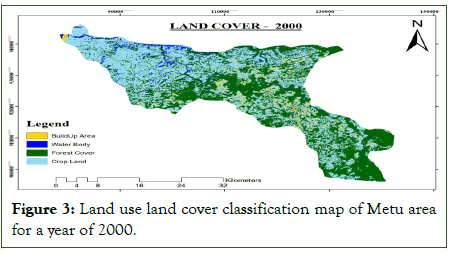
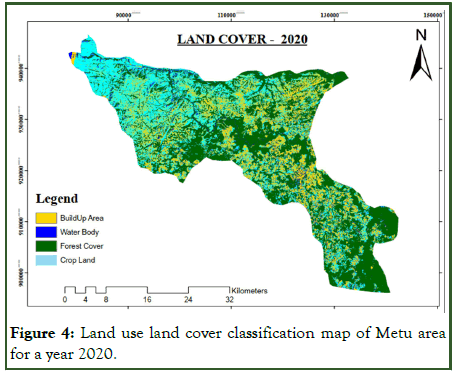
Classification of remotely sensed data is used to assign corresponding levels with respect to groups with homogeneous characteristics. Classification was executed on the base of spectral or spectrally defined features, such as density, texture etc. in the feature space. It can be said that classification divides the feature space into several classes based on a decision rule. The study area was defined to have four land uses and land cover categories such as buildup area, water body, forest cover and crop land. The overall land use land cover classification for 2000 (Figure 3) and 2020 (Figure 4) image classification accuracy were 82% and 90% and kappa coefficient were 0.79 and 0.83 respectively. The overall accuracy of the study area was fit with the standard and the Kappa coefficient of classified land and the overall accuracy standard of our LULC are acceptable.
Figure 3: Land use land cover classification map of Metu area for a year of 2000.
Figure 4: Land use land cover classification map of Metu area for a year 2020.
According to Anderson, the recommended standard of accuracy in the identification of LULC change mapping from the remote sensing data should be 80 to 90% [16]. The Kappa coefficient was also used to assess the classification accuracy. A Kappa coefficient is between 0.61-0.80 (Substantial) and 0.81-1 almost perfect agreement where as a value close to zero means that the agreement is no better than would be expected by chance. It expresses the proportionate reduction in error generated by a classification process compared with the error of a completely random classification [17].
Land use land cover dynamics between 2000 and 2020
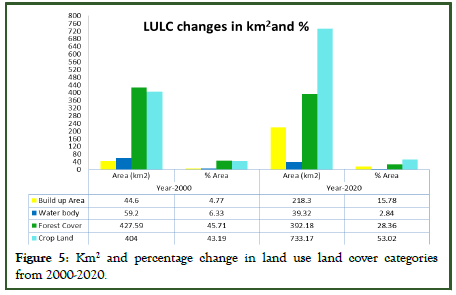
Over twenty years (2000-2020), the gross changes in area coverage varied from one LULC class to another LULC class. Built up areas and croplands are the most increased and forest and water bodies undergoing the most decreased in area coverage (Figure 4). The result of this study showed that built up and croplands increased from 44.6 km2 (4.77%) and 404 km2 (43.19%) in 2000 to 218.3 km2 (15.78%) and 733.17 km2 (53.02%) respectively in 2020. Forest cover and water body decreased during this period, forests decreasing from 427.59 km2 (45.71%) in to 392.18 km2 (28.36%) coverage in 2000 and 2020 respectively. Similarly, water body also decreased from 59.2 km2 (6.33%) into 39.32 km2 (2.84%) coverage in 2000 and 2020 respectively (Table 2).
| LULC type | Year-2000 | Year-2020 | ||
|---|---|---|---|---|
| Area (km2) | % Area | Area (km2) | % Area | |
| Build up area | 44.6 | 4.77 | 218.3 | 15.78 |
| Water body | 59.2 | 6.33 | 39.32 | 2.84 |
| Forest cover | 427.59 | 45.71 | 392.18 | 28.36 |
| Crop land | 404 | 43.19 | 733.17 | 53.02 |
Table 2: Results of LULC changes from 2000 and 2020 time periods showing area changed for each class in kilometer square and percentage LULC changes.
These changes took place at the expense of other LULC classes as seen in the change detection matrices. LULC changes are complex and at the same time interrelated such that the expansion of one LULC type occurs at the expense of other LULC classes [18]. In their study in Dembecha area, northwestern Ethiopia, found out that the expansion of cultivated land took place at the expense of forest land between 1957 and 1982 [19]. Similarly, other researches have revealed that the expansion of agricultural land has been at the expense of lands with natural vegetation cover [20].
Land use land cover change detection for the years 2000 and 2020
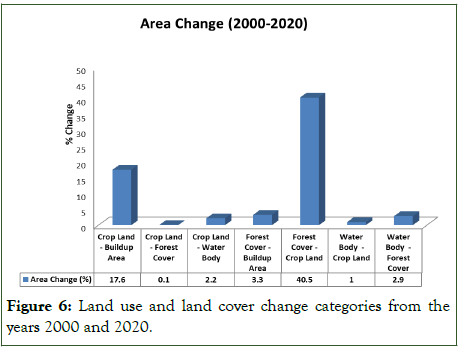
Change detection between 2000 and 2020: 53.02%, 28.36%, 15.78% and 2.84% of land under crop land, forest cover, builtup area and water body, respectively in 2020. However, there were also significant conversions from one land cover category to another land cover categories. There were significant conversions from forest cover to crop land (40.5%) and to build up area (3.3%). Some area under water body was converted to forest area (2.9%) and crop land (1%). Crop lands also converted to build up area by 17.6% (Figure 5).
Figure 5: Km2 and percentage change in land use land cover categories from 2000-2020.
Figure 6: Land use and land cover change categories from the years 2000 and 2020.
In general, the area of natural forests and water bodies consistently decreased with varied proportions over the study periods. The reductions of these LULC types were mainly attributed to the conversion of the areas to croplands and expansion of urbanization. This is due to the rapid growth and expansion of urban, rapid population growth as a result; the shortage of arable land has led to expansion of cultivation into deforestation, charcoal burning and the need for more production. This indicates population playing a major role in these aspects.
Conclusion
Land use and land cover estimates are among the most essential information in any land management practice. Land use and land cover change is a major issue of concern with regards to change in the global environment. The rapid growth and expansion of urban, rapid population growth, scarcity of land, the need for more production, changing technologies are among the many drivers of LULCC in the world today. In this work, it was proven that the supervised classification of multi-temporal satellite images is an effective tool to quantify current land use as well as to detect changes in a changing environment. Landsat 7 and 8 satellite images of 2000 and 2020 were used for the GIS and RS image analysis.
The observed changes varied from one LULC category to another category over analysis periods. In the study area, significant conversion from forests to crop land and build up area. Similarly, water body was converted to forest area and crop land. Crop lands also converted to build up area. The analyses also showed that forest cover declined from 427.59 km2 (45.71%) to 392.18 km2 (28.36%) while crop land increased from 404 km2 (43.19%) to 733.17 km2 (53.01%) in 2000 and 2020 respectively.
This study advocates that multi-temporal satellite data is very useful to detect the changes in land use and land cover comprehensively. Land use and land cover changes have wide range of consequences at all spatial and temporal scales. The study reveals that the LULC pattern and its spatial distribution are the major rudiments for the foundation of a successful landuse strategy required for the appropriate development of any study area. This research is important to inform policy makers on the status and change of land use land cover for further planning and intervention.
References
- Forests FA. Agriculture: Land-use challenges and opportunities. State of the World’s Forests. 2016:1545-2050.
- Qian J, Zhou Q, Hou Q. Comparison of pixel-based and object-oriented classification methods for extracting built-up areas in arid zone. ISPRS workshop on updating Geo-spatial databases with imagery and the 5th ISPRS workshop on DMGISs, Urumqi, China. 2007;8:163-171.
- Gimblett HR. Modelling Human-Landscape Interactions in Spatially Complex Settings: Where are we and where are we going. MODSIM 2005 International Congress on Modelling and Simulation, Modelling and Simulation Society of Australia and New Zealand. 2005.
- Chaudhary S, Chettri N, Uddin K, Khatri TB, Dhakal M, Bajracharya B, et al. Implications of land cover change on ecosystems services and people’s dependency: A case study from the Koshi Tappu Wildlife Reserve, Nepal. Ecol Complex. 2016;28:200-211.
- Kindu M, Schneider T, Teketay D, Knoke T. Drivers of land use/land cover changes in Munessa-Shashemene landscape of the south-central highlands of Ethiopia. Environ Monit Assess. 2015;187:1-7.
[Crossref] [Google Scholar] [PubMed]
- Obersteiner M, Walsh B, Frank S, Havlík P, Cantele M, Liu J, et al. Assessing the land resource-food price nexus of the Sustainable Development Goals. Sci Adv. 2016;2(9):e1501499.
[Crossref] [Google Scholar] [PubMed]
- Ellis E, Pontius R. Land-use and land-cover change. Encycl Earth. 2007;1:1-4.
- Hailemariam SN, Soromessa T, Teketay D. Land use and land cover change in the bale mountain eco-region of Ethiopia during 1985 to 2015. Land. 2016;5(4):41.
- Wondie M, Schneider W, Katzensteiner K, Mansberger R, Teketay D. Modelling the dynamics of landscape transformations and population growth in the highlands of Ethiopia using remote-sensing data. Int J Remote Sens. 2016;37(23):5647-5667.
- Mekonnen Z, Berie HT, Woldeamanuel T, Asfaw Z, Kassa H. Land use and land cover changes and the link to land degradation in Arsi Negele district, Central Rift Valley, Ethiopia. Remote Sens Appl Soc Environ. 2018;12:1-9.
- WoldeYohannes A, Cotter M, Kelboro G, Dessalegn W. Land use and land cover changes and their effects on the landscape of Abaya-Chamo Basin, Southern Ethiopia. Land. 2018;7(1):2.
- Coppin P, Jonckheere I, Nackaerts K, Muys B, Lambin E. Review ArticleDigital change detection methods in ecosystem monitoring: A review. Int J Remote Sens. 2004;25(9):1565-1596.
- Eastman JR. IDRISI Kilimanjaro: Guide to GIS and image processing. Clark Labs, Worcester, USA. 2003.
- Chen D, Stow D. The effect of training strategies on supervised classification at different spatial resolutions. Photogramm Eng Remote Sens. 2002;68(11):1155-1162.
- Owojori A, Xie H. Landsat image-based LULC changes of San Antonio, Texas using advanced atmospheric correction and object-oriented image analysis approaches. 5th International Symposium on Remote Sensing of Urban Areas, Tempe, USA. 2005.
- Anderson JR. A land use and land cover classification system for use with remote sensor data. U.S. Geological Survey Circular 671. 1976.
- Murty PS, Tiwari H. Accuracy assessment of land use classification-A case study of Ken Basin. J Civ Eng Archit Res. 2015;2(12):1199-1206.
- Shiferaw A, Singh KL. Evaluating the land use and land cover dynamics in Borena Woreda South Wollo Highlands, Ethiopia. Ethiop J Bus Econ (The). 2011;2(1).
- Zeleke G, Hurni H. Implications of land use and land cover dynamics for mountain resource degradation in the Northwestern Ethiopian highlands. Mt Res Dev. 2001;21(2):184-191.
- Amsalu A, Stroosnijder L, de Graaff J. Long-term dynamics in land resource use and the driving forces in the Beressa watershed, highlands of Ethiopia. J Environ Manage. 2007;83(4):448-459.
[Crossref] [Google Scholar] [PubMed]
Citation: Adisu B (2025) Assessment of Land Use and Land Cover Change Using GIS and Remote Sensing Techniques around Metu District, South Western Ethiopia. J Remote Sens GIS. 14:368.
Copyright: © 2025 Adisu B. This is an open-access article distributed under the terms of the Creative Commons Attribution License, which permits unrestricted use, distribution, and reproduction in any medium, provided the original author and source are credited.
