Indexed In
- Open J Gate
- Academic Keys
- RefSeek
- Hamdard University
- EBSCO A-Z
- OCLC- WorldCat
- Publons
- Euro Pub
- Google Scholar
- SHERPA ROMEO
Useful Links
Share This Page
Journal Flyer

Open Access Journals
- Agri and Aquaculture
- Biochemistry
- Bioinformatics & Systems Biology
- Business & Management
- Chemistry
- Clinical Sciences
- Engineering
- Food & Nutrition
- General Science
- Genetics & Molecular Biology
- Immunology & Microbiology
- Medical Sciences
- Neuroscience & Psychology
- Nursing & Health Care
- Pharmaceutical Sciences
Research Article - (2021) Volume 0, Issue 0
Arterio-Venous Fistula Recirculation in Hemodialysis: Causes and Prevalence
Magdy Mohammad El-Sharkawy, Aber Halim Baky*, Mohammed Mustafa and Rania Roshdy Ahmed SadekReceived: 02-Aug-2021 Published: 13-Sep-2021, DOI: 10.35248/2329-6925.21.s7.001
Abstract
Recirculation is an important issue in hemodialysis (HD) patients as increased percent recirculation causes decreased dialysis delivery of the patients. The purpose of the study was to determine the prevalence and possible causes of recirculation in those patients. The study was a cross sectional one carried in the department of Nephrology, Ain Shams University Hospitals. A total of 100 end stage renal disease patients with arterio-venous fistula who were on HD for more than 3 months were purposively selected. The degree of recirculation was measured with urea based two needle technique method. For each patient distances between arterial and venous and distances of needles from fistula and its directions were recorded. Echocardiography and A-V fistula Colour Doppler Ultrasound were also performed for patients with high degree recirculation percent (more than 10%). The prevalence of A-V fistula recirculation was 55% with a range 0-66%. The most common factors were close proximity and improper arterial and venous needles placement. No difference was observed between diabetic and non- diabetic also between hypertensive and normotensive. A-V fistula recirculation is common occurrence in HD patients and the most common factors of recirculation are misplacement and close proximity of needles therefore emphasis should be given on education and training of HD staffs
Keywords
Arteriovenous fistula; Recirculation; Hemodialysis; Ultrasound dilution technique
Introduction
The dialysis prescription must ensure that an adequate amount of dialysis is delivered to the patient. Inadequate dialysis is an important contributor to lower overall survival among patients undergoing maintenance dialysis. Therefore, assessment of dialysis adequacy is a central issue in the management of these patients [1]. It is well established that one of cause of inadequate dialysis in HD patients is Arterio-Venous (AV) fistula Access Recirculation (AR) [2]. Hemodialysis AR is suspected when the blood urea concentration in arterial line is lower than that of systemic circulation, indicating that dialyzed blood returning through the venous needle reenters the HD machine through the arterial needle [3].
It is also suggested that high degree of AR is one of the surrogate markers of AV fistula inflow problems and periodic assessment of AR can be used as a screening tool for early detection of this problem, which improves long-term AV fistula patency rates [4].
An accurate assessment of access fistula recirculation can be made by urea-based method as well as nonurea-based techniques using ultrasound dilution technique, conductivity, or potassium-based dilutional method [5]. Any access recirculation is abnormal. Recirculation exceeding 10% using the recommended two-needle urea-based method, or 5% using a non-urea based dilutional method, should prompt investigation of its cause [6].
Material and Methods
This study was conducted on one hundred patients with end stage renal disease undergoing hemodialysis sessions from Ain Shams university hospital HD unit. The degree of recirculation will be measured with Urea based two needle technique method. Inclusion criteria were Patients undergoing hemodialysis by arterio-venous fistula for more than six months, more than 18 years and those who have a well-regulated anticoagulation regimen during dialysis therapy. Exclusion criteria, patients undergoing hemodialysis by temporary access or permanent catheter were excluded.
History of vascular access including number of failed fistula, site of failed fistula (same limb, other limb or both) and history of venous catheter insertion (same site or opposite site) was obtained for all the study population. Also Hemoglobin%, calcium, phosphorus, PTH and albumin were measured. Urea Reduction Rate (URR) was calculated for all study patients.
The degree of recirculation was measured with Urea based two needle method from the following formula: Percent recirculation= ([P-A] ÷ [P-V]) × 100.Where P, A, and V refer to the urea concentrations in the peripheral blood, pre-dialyzer arterial line, and post-dialyzer venous circuit, respectively. The following protocol was used for blood sampling. The ultrafiltration was turned off approximately 30 minutes after the initiation of HD and then arterial and venous line samples were obtained. Access blood flow was reduced to 50 mL/min and 15 to 30 seconds later, the systemic blood sample from the arterial blood line was obtained. The patients were divided into two groups: group 1 patients with more than 10% recirculation and group II patients with less or equal to 10% recirculation. For each patient distances between arterial and venous needles and distances of needles from A-V fistula and its directions was recorded. Echocardiography and A-V fistula Color Doppler Ultrasound were also performed for patients with more than 10% recirculation. Association between risk factors and recirculation rate was evaluated by COX regression model. Doppler was done to assess the AVF for thrombosis or stenosis in patients with recirculation percentage more than 10% (group II).
Doppler ultrasound offers the advantage of a non-invasive bedside procedure with lower costs and with no need for radio-contrast in order to assess the vascular access. It is also recommended that fistulography should be performed in elevated levels of access recirculation to determine whether stenotic lesions are impairing access blood flow
Results
The study passed through 2 phases. In phase I we assessed the AVF for recirculation by urea based two needle techniques. The prevalence of recirculation among the study population was found 55 patients out of 100 patients (55%). In phase II, the Patients were divided into two groups based on percentage of recirculation: Group I: 55 patients with recirculation percent more than 10% while Group II: 45 patients with recirculation percent less than or equal 10%.
In this current study it was observed that the age range varied from 18 to 86 years in whole study patients. The mean age was 52.60 ± 12.59 in group I and 47.16 ± 15.84 in group II. Age difference was not statistically significant (p>0.05).
In our study 55 patients were female and 45 patients were male. Table 1 shows that there was no statistically significant difference found between group I and group II regarding history of HTN, DM, vascular disease, heart disease and ejection fraction with p-value=0.787, 0.542, 0.805, 0.707 and 0.693 respectively. Table 2 shows comparison between the both groups regarding the laboratory data including HB%, Ca+2, phosphorus, PTH, albumin, and no statistically significant difference was found with P-value=0.058, 0.608,0.539, 0.062, 0.645, respectively. But we found statistically significant difference between both groups regarding the urea reduction ratio with P-value=0.000.
| Group I | Group II | Chi square test | |||
|---|---|---|---|---|---|
| n=45 | n=55 | χ2/ t* | P-value | ||
| History of HTN | Negative | 16 (35.6%) | 21 (38.2%) | 0.073 | 0.787 |
| Positive | 29 (64.4%) | 34 (61.8%) | |||
| History of DM | Negative | 41 (91.1%) | 48 (87.3%) | 0.372 | 0.542 |
| Positive | 4 (8.9%) | 7 (12.7%) | |||
| Vascular disease | Negative | 40 (88.9%) | 48 (87.3%) | 0.061 | 0.805 |
| Positive | 5 (11.1%) | 7 (12.7%) | |||
| Heart Disease | Negative | 35 (77.8%) | 41 (74.5%) | 0.142 | 0.707 |
| Positive | 10 (22.2%) | 14 (25.5%) | |||
| Ejection fraction | Mean±SD | 61.89 ± 7.02 | 61.31 ± 7.50 | 0.396* | 0.693 |
| Range | 49–76 | 49–78 | |||
Table 1: Comparison between group I and group II regarding history of HTN, DM, vascular data, heart disease, ejection
| Group I | Group II | Independent t-test | |||
|---|---|---|---|---|---|
| n=45 | n=55 | T | P-value | ||
| Hb % | Mean±SD | 10.52 ± 2.26 | 11.30 ± 1.79 | -1.920 | 0.058 |
| Range | 7.20–15.60 | 6.80–14.90 | |||
| Ca+2 | Mean±SD | 9.19 ± 0.99 | 9.07 ± 1.34 | 0.514 | 0.608 |
| Range | 7.40–12.10 | 6.10–13.60 | |||
| PO-24 | Mean±SD | 3.38 ± 1.67 | 3.60 ± 1.86 | -0.617 | 0.539 |
| Range | 1.10–7.80 | 0.90–9.10 | |||
| PTH | Median (IQR) | 517 (208–987) | 739 (382–1353) | 1.867 | 0.062 |
| Range | 51–2087 | 78–2534 | |||
| Albuim | Mean±SD | 3.89 ± 0.55 | 3.84 ± 0.54 | 0.462 | 0.645 |
| Range | 3.00–5.90 | 2.30–5.20 | |||
| Urea reduction ratio | Mean±SD | 71.99 ± 11.3 | 59.66 ± 15.66 | 4.421 | 0.000 |
| Range | 39.4–92.9 | 20–84.6 | |||
Table 2: Comparison between group I and group II regarding laboratory data.
Figure 1 shows significant negative correlation between urea reduction rate and the percentage of recirculation was found in both groups with P-value=0.000. Table 3 shows that the median value of recirculation percentage among the population of the study were 11.9 with range 1.03–65.71, then we divide the patients into two groups according to recirculation percentage where 45 patients had recirculation percentage less than 10% (Group I) and 55 patients had recirculation percentage more than 10% (Group II). Table 4 shows that there was high statistically significant difference found between group I and group II regarding direction of needles and the distance between the needles with P- value=0.000. also it was found that there was statistically significant difference between the both groups regarding site of failed fistula with P-value=0.032 while there was no statistically significant difference between the both groups regarding number of catheter insertion and number of failed fistula.
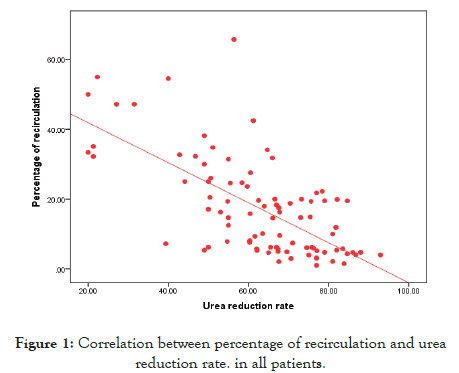
Figure 1: Correlation between percentage of recirculation and urea reduction rate. in all patients.
|
No=100 |
|
| Percentage of recirculation | Median (IQR) | 11.9 (5.15–22.01) |
| Range | 1.03–65.71 | |
| Groups | Group I (≤ 10) | 45 (45.0%) |
| Group II (> 10) | 55 (55.0%) | |
Table 3: Percentage of recirculation in the study population and the number of patients in each group based on recirculation percentage.
|
Group I |
Group II |
Chi square test |
||
|---|---|---|---|---|---|
n=45 |
n=55 |
χ² |
P-value |
||
| Direction of needles | Opposite direction | 39 (86.7%) | 20 (36.4%) | 25.890 | 0.000 |
| Same direction | 6 (13.3%) | 35 (63.6%) | |||
| Distance between A and V needles | > 6 cm | 36 (80.0%) | 15 (27.3%) | 27.535 | 0.000 |
| < 6 cm | 9 (20.0%) | 40 (72.7%) | |||
| No of venous catheter insertion | No | 3 (6.7%) | 4 (7.3%) | 0.209 | 0.901 |
| One | 15 (33.3%) | 16 (29.1%) | |||
| Multiple | 27 (60.0%) | 35 (63.6%) | |||
| No. of failed fistula | 0 | 24 (53.3%) | 34(61.8%) | 3.425 | 0.489 |
| 1 | 17 (37.8%) | 13 (23.6%) | |||
| 2 | 2 (4.4%) | 2 (3.6%) | |||
| 3 | 1 (2.2%) | 2 (3.6%) | |||
| 4 | 1 (2.2%) | 4 (7.3%) | |||
| Site of failed fistula | Same side | 6 (28.6%) | 10 (47.6%) | 6.867 | 0.032 |
| Opposite | 14 (66.7%) | 6 (28.6%) | |||
| Both sides | 1 (4.8%) | 5 (23.8%) | |||
Table 4: Comparison between group I and group II regarding cannulation technique and vascular access history.
Figure 2 shows that 55% of all the study patients had recirculation more than 10% (Group II) while 45% had recirculation less than or equal 10% (Group I). The Figure 3 shows comparison between the both groups regarding the site of failed fistula in which the site of failed fistula in most of the patient in group I (66.7%) were in the opposite side while the rest of group I were in the same side and in the both sides with percentage of 28.6% and 4.8% respectively in group II 47.6% had history of failed fistula in the same side while 28.6% in the opposite side and 23.8% in both sides.
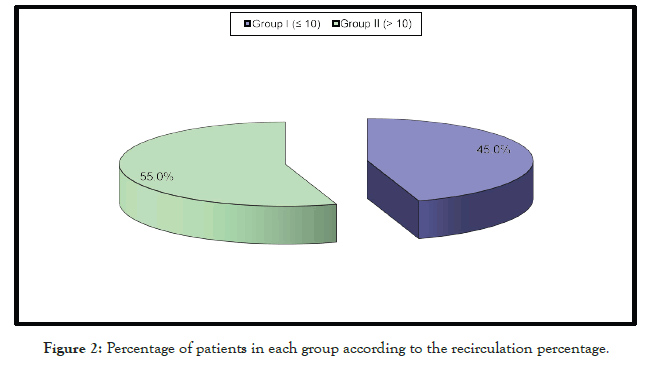
Figure 2: Percentage of patients in each group according to the recirculation percentage.
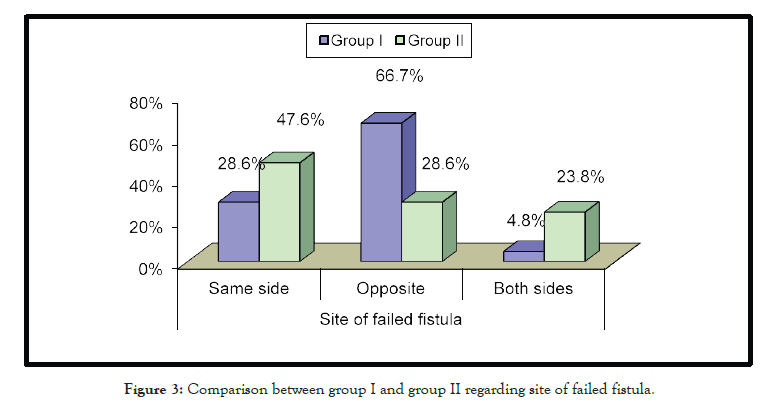
Figure 3: Comparison between group I and group II regarding site of failed fistula.
The Figure 4 shows comparison between the both groups regarding the distance between the needles which reveals that most of the patients in group I (80%) had more than 6cm between the A&V needles while only 20% had less than 6cm between the needles on the contrary 72.2% of patients in group II had less than 6cm between the needles while 27.3% more than 6 cm between the needles.
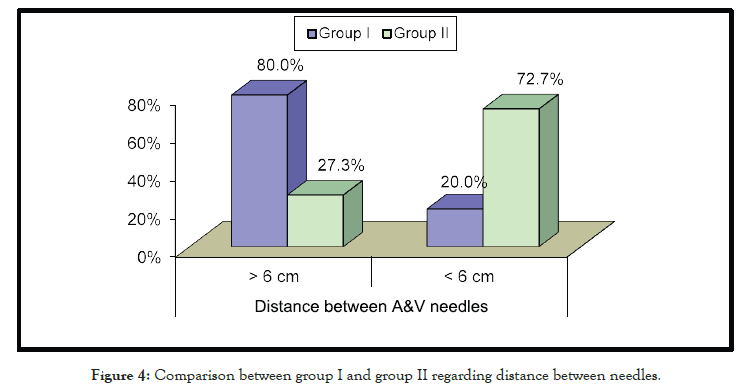
Figure 4: Comparison between group I and group II regarding distance between needles.
The Figure 5 shows comparison between the both groups regarding direction of needles and reveals that most of the patients in group I (86.7%) had the opposite direction of the needles and 13.3% had the same direction on the contrary 63.6% of the patients in group II had the same direction of needles while 36.4% had the opposite direction of needles.
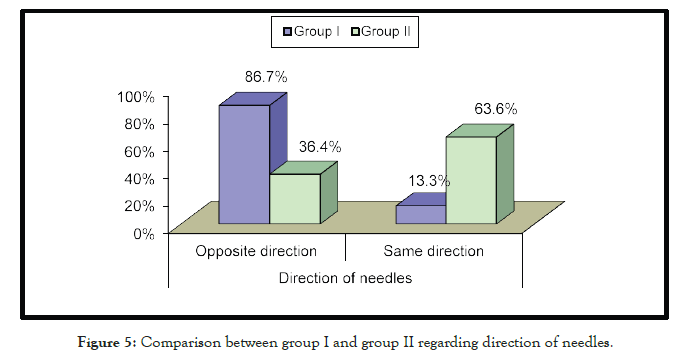
Figure 5: Comparison between group I and group II regarding direction of needles.
Table 5 shows logistic regression analysis and it was found that there was highly statistically significant association found between recirculation and same direction of needles with p-value<0.001 and odds ratio with 95% CI of 11.375 (4.1–31.548) and also highly statistically significant association found with distance between AV needles<6 with p-value<0.001 and OR with 95% CI of 10.667 (4.162- 27.337) while no statistically significant association found between patients with recirculation and same site of failed fistula. Table 6 shows no statistically significant correlation between percentage of recirculation and left ventricular ejection fraction in all patients in the study with P-value=1.000.
| B | S.E. | Wald | P-value | Odds ratio (OR) |
95% C.I. for OR | ||
|---|---|---|---|---|---|---|---|
| Lower | Upper | ||||||
| Same direction of needles | 2.431 | 0.520 | 21.824 | 0.000 | 11.375 | 4.101 | 31.548 |
| Distance between AV needles< 6 | 2.367 | 0.480 | 24.303 | 0.000 | 10.667 | 4.162 | 27.337 |
| Same site of failed fistula | 0.821 | 0.651 | 1.589 | 0.208 | 2.273 | 0.634 | 8.146 |
Table 5: Logistic regression for predictions of patients with recirculation.
| Percentage of recirculation | ||||||
|---|---|---|---|---|---|---|
| All Groups | Group І | Group II | ||||
| n=100 | n=45 | n=55 | ||||
| R | P-value | r | P-value | R | P-value | |
| Ejection fraction | 0.000 | 1.000 | -0.191 | 0.209 | 0.082 | 0.551 |
Table 6: Correlation between percentage of recirculation and left ventricular ejection fraction.
The previous table shows no statistically significant correlation between percentage of recirculation and left ventricular ejection fraction in all patients in the study with P-value=1.000.
Table 7 shows that blood flow in three patients in group II (6%) was poor while the flow in the rest of patients in group II (94%) was good.
|
No=50 |
|---|---|
| Good flow | 47 (94.0%) |
| Poor flow | 3 (6.0%) |
Table 7: The results of AVF Doppler in group II.
Discussion
One hundred patients were enrolled in this study, the AVFs were assessed for recirculation by two needle urea based equation and then patients were divided into 2 groups based on the percentage of recirculation. Patients with recirculation percentage equal or less than 10% were classified as group I, while patients with recirculation percentage more than 10% were in group II. The both groups were subjected to clinical and laboratory assessment. Patients in group II were assessed to find the causes of recirculation by investigating the patients with Echo and venous Doppler.
In our study, the prevalence of recirculation was 55% [7] was observed that 82.2% of patients had recirculation, which is consistent with Salami et al, where the investigators showed 80.4% of patients had recirculation. On the other hand On the other hand (Mousavi B) [8] showed 17.0% which may be due to their health professional are well trained as well as their availability of modern facilities in their hospital.
In this current study it was observed that the age range varied from 18 to 86 years in whole study patients. The mean age was 52.60 ± 12.59 years in group I and 47.16 ± 15.84 years in group II. Age difference was not statistically significant in both groups (p>0.05).
It was found that there was no statistically significant difference found between groups I and group II regarding sex. Recirculation was higher in females which have relative low blood flow through fistula than their male counterpart fistula than their male counterpart (Whittier WL) [9]. which is consistent with our study that females were slightly more than males in recirculation.
Our study found also that there was no statistically significant difference between both groups regarding the history of vascular disease and heart disease DM and hyperytension. In agreement with our study, with our study (Mahbub T), [7] found that No difference was observed between diabetic and non-diabetic also between hypertensive and normotensive patients in their study
In our study, we found that there was a high statistically significant difference between group I and group II as regard the cannulation technique with P-value less than0.001. The number of patients who had dialysis needles in the same direction was higher in group II than patients in group I (20 patients versus 6 patients respectively) and the number of patients who had distance between the arterial and venous needles less than 6 cm was higher in group II than number of patients in group I.
In our study we found that improper needle placement is the most common cause of backflow or recirculation in their HD center [10] Schneditz have also reported that improper needle placement by HD staff is a common source of A-V fistula recirculation.
Contrary to our study, Contrary to our study (Hayati F), [11] found that the most common cause of AR is the presence of high-grade venous stenosis, which restricts dialyzed blood venous outflow. The other common cause of AR is inadequate arterial blood flow rate when the A-V fistula blood flow rate is less compared to the blood pump of HD machine.
Also in this study we found that no statistically significant difference between both groups regarding the frequency of prior failed fistula.
In our study we found that there was no statistically significant difference between the both groups as regards the laboratory data including Hb%, calcium, phosphorus, PTH, albumin also there was no correlation between these laboratory data and A-V fistula recirculation.
There was a significant statistically difference between both groups regarding the URR and it was found that there was significant negative correlation between Urea Reduction Ratio (URR) and percentage of recirculation in both groups with P-value less than 0.001.
In this study we lost five patients from group II (four patients died and one had renal transplant surgery) before investigating them with Doppler while the rest of the patients in group II were investigated with AVF Doppler to detect intra-access flow, we found that three patients had poor flow while the rest of patients in group II had a good blood flow. The small number of patients that had poor flow using AVF Doppler did not permit assessment of flow contribution to AVF recirculation.
Tonelli et al. [3] suggested that low access blood flow (Qa), and high AR are both associated with access failure and based on Canadian guidelines, recommend regular bi-monthly screening of native vessel AVF, using Ultrasound Dilution Techniques (UDT) to measure both Qa and AR.
In our study we found that the most common cause of recirculation among the study population was the improper needles placement and close proximity between arterial and venous needles. Fistula resistance was less common cause of recirculation as it is a late indicator of Stenosis and almost >50% Stenosis is required for a significant hemodynamic effect [9].
Conclusion
The measurement of A-V Fistula Recirculation has important diagnostic implications in HD patients because it results in inadequate dialysis. According to our study, AR was a common occurrence. Although, the role of improper arterial and venous needles placement in recirculation usually ignore, it was the most common cause in our HD patients. Therefore we should have more emphasis on education and training of HD staff on proper needle placement. It is also recommended that among patients with a new A-V fistula, an access diagram should be obtained from their surgeon (who constructed the access) to aid HD staff for appropriate placement of arterial and venous needles during HD session.
REFERENCES
- Zeraati A, Mousavi BS, Mousavi BM. A review article: access recirculation among end stage renal disease patients undergoing maintenance hemodialysis. Nephrourol Mon. 2013;5(2):728-732.
- Shayanpour S, Faramarzi M. Arteriovenous fistula recirculation in hemodialysis. Nephro Urol Mon. 2015;7(4):e27474.
- Tonelli M, Jindal K, Hirsch D, Taylor S, Kane C, Henbrey S. Screening for subclinical stenosis in native vessel arteriovenous fistulae. J Am Soc Nephrol. 2001;12(8):1729-1733.
- Tentori F, Hunt WC, Rohrscheib M, Zhu M, Stidley CA, Servilla K, et al. Which targets in clinical practice guidelines are associated with improved survival in a large dialysis organization? J Am Soc Nephrol. 2007;18(8):2377-2384.
- Brancaccio D, Tessitore N, Carpani P, Gammaro L, Losi B, Zoni U, et al. Potassium-based dilutional method to measure hemodialysis access recirculation. Int J Artif Organs. 2001;24(9):606-613.
- Hemodialysis Adequacy 2006 Work Group. Clinical practice guidelines for hemodialysis adequacy, update 2006. Am J Kidney Dis. 2006;48:S2-S90.
- Mahbub T, Chowdhur NU, Jahan F, Noman MU, Rahman M, Khan MF, et al. Estimation of recirculation in arteriovenous fistula among hemodialysis patients. Bangladesh J Medicine. 2014;25:17-20.
- Mousavi B, Tavazoe M, Hayati F, Sametzadeh M. Arterio-venous fistula recirculation in hemodialysis: Causes and prevalences. Shiraz E-Medical Journal. 2010;11(4):20447.
- Whittier WL. Surveillance of hemodialysis vascular access. Semin Interval Radiol. 2009;26(2):130-138.
- Schneditz D, Daugirdas JT. Compartment effects in hemodialysis. Semin Dial. 2001;14(4):271-277.
- Hayati F, Shayanpour S and Faramarzi M. Access Recirculation in Hemodialysis. Shiraz E-Med J. 2015;16(3):e59875.
Citation: El-Sharkawy MM, Baky Halim A, Mustafa M, Sadek RRa (2021) Arterio-Venous Fistula Recirculation in Hemodialysis: Causes and Prevalence. J Vasc Med Surg. S7: 001.
Copyright: © 2021 El-Sharkawy MM, et al. This is an open-access article distributed under the terms of the Creative Commons Attribution License, which permits unrestricted use, distribution, and reproduction in any medium, provided the original author and source are credited.
