


Indexed In
- CiteFactor
- RefSeek
- Directory of Research Journal Indexing (DRJI)
- Hamdard University
- EBSCO A-Z
- Scholarsteer
- Publons
- Euro Pub
- Google Scholar
Useful Links
Share This Page
Journal Flyer

Open Access Journals
- Agri and Aquaculture
- Biochemistry
- Bioinformatics & Systems Biology
- Business & Management
- Chemistry
- Clinical Sciences
- Engineering
- Food & Nutrition
- General Science
- Genetics & Molecular Biology
- Immunology & Microbiology
- Medical Sciences
- Neuroscience & Psychology
- Nursing & Health Care
- Pharmaceutical Sciences
Research Article - (2024) Volume 12, Issue 1
Application of Robustness Analysis in Rural Poverty-Stricken Family Return-to-Poverty Risk Warning
Yungang Tang1,2*, Haojie Liao2, Gang Lei3 and Ye Wu12Department of Economics, New Era University College, Kajang, Selangor, Malaysia
3Department of Science and Technology, Guangdong University, Guangdong, Dongguan, China
Received: 11-Jan-2024, Manuscript No. RPAM-24-24583; Editor assigned: 15-Jan-2024, Pre QC No. RPAM-24-24583 (PQ); Reviewed: 29-Jan-2024, QC No. RPAM-24-24583; Revised: 05-Feb-2024, Manuscript No. RPAM-24-24583 (R); Published: 12-Feb-2024, DOI: 10.35248/2315-7844.24.12.438
Abstract
Measuring and warning the risk of returning to poverty in rural poverty-stricken families is a important means to prevent and reduce poverty relapse, and it is also an important indicator for evaluating the effectiveness of poverty alleviation policies. The robustness analysis method is applied to the measurement and warning mechanism construction of the return-to-poverty risk in rural poverty-stricken families. This method is an optimization decision- making approach under conditions of uncertainty. It can ensure that the optimization results satisfy the constraints within a certain range without the need to know the distribution of uncertain parameters or membership functions. Based on the 2020 China Family Tracking Survey data, a comprehensive indicator system is constructed, encompassing both external risks and internal capabilities. The robustness analysis method is then used to calculate the return-to-poverty risk levels of 4,477 rural poverty-stricken households. Four warning levels are defined based on the results, and corresponding warning measures are proposed. The research reveals that the return-to-poverty risk of rural poverty-stricken families follows a right-skewed distribution with significant variations and hierarchies. Rural poverty-stricken families’ return-to-poverty risk is influenced by various factors, including external shocks, economic fluctuations, living conditions, and human and social aspects, with inherent connections among these factors. Differentiated and personalized assistance services, including preventive, responsive, and restorative measures, are needed for rural poverty-stricken families of different warning levels, types, or groups. This study provides a new perspective and tool for preventing and reducing the return to poverty in rural poverty-stricken families.
Keywords
Rural poverty-stricken families; Return-to-poverty risk; Robustness analysis; Warning levels; Warning measures
Introduction
Rural households that have escaped poverty are those that have escaped absolute poverty, but are still in relative or marginal poverty [1,2]. Although these households have achieved poverty alleviation, they still face the risk of returning to poverty, that is, the possibility of falling back into poverty due to external factors such as natural disasters, social conflicts, market fluctuations, policy changes, or internal factors such as insufficient self-capacity [3-11]. Preventing and reducing the return to poverty of rural households that have escaped poverty is an important task to consolidate the achievements of poverty alleviation, achieve rural revitalization, and build a socialist modernized powerful country [12-16]. To this end, it is necessary to scientifically measure and warn the risk of returning to poverty of rural households that have escaped poverty, so as to timely detect the hidden dangers of returning to poverty, formulate effective assistance measures, and improve the anti-risk ability and quality of life of rural households that have escaped poverty [17-20].
At present, the research on the measurement and early warning of the risk of returning to poverty of rural households that have escaped poverty has made some progress, mainly including the following methods: based on livelihood vulnerability, by analysing the livelihood capital, livelihood strategy and livelihood outcome of rural households that have escaped poverty, to evaluate their risk of returning to poverty; based on multidimensional poverty, by comprehensively considering the performance of rural households that have escaped poverty in multiple dimensions such as income, health, education, housing, etc., to measure their risk of returning to poverty; based on stochastic programming, by constructing an optimization model with stochastic parameters, to solve the optimal income level and minimum risk of returning to poverty of rural households that have escaped poverty under uncertain conditions; based on fuzzy programming, by constructing an optimization model with fuzzy parameters or objectives, to solve the optimal income level and minimum risk of returning to poverty of rural households that have escaped poverty under fuzzy conditions [21- 27]. These methods have their own advantages and disadvantages, but they also have some common or specific limitations, such as ignoring the impact of uncertainty factors, lacking consideration of risk adaptation ability, high computational complexity, unstable results, etc.
This paper attempts to study the measurement and early warning of the risk of returning to poverty of rural households that have escaped poverty from a new perspective that is, using robustness analysis method [28]. Robustness analysis method is a method for making optimization decisions under uncertainty conditions [29,30]. It can guarantee that the optimization results meet the constraint conditions within a certain range without knowing the distribution or membership function of uncertain parameters. This method has the characteristics of flexibility, reliability, robustness, sensitivity and efficiency. It is applicable to various uncertainty conditions. The study believes that the risk of returning to poverty of rural households that have escaped poverty is jointly determined by exogenous risk and endogenous ability. Exogenous risk refers to uncertain factors that affect the income and expenditure of rural households that have escaped poverty, such as natural disasters, market fluctuations, policy changes, etc.; endogenous ability refers to the ability of rural households that have escaped poverty to resist exogenous risks [31]. It mainly depends on their possession of five kinds of capital (natural capital, physical capital, financial capital, human capital and social capital). Based on the 2020 China Family Tracking Survey data, an indicator system containing exogenous risk and endogenous ability was constructed. Using robustness analysis method, the risk level of returning to poverty for 4477 rural households that have escaped poverty was calculated. Based on this, four early warning levels were divided and corresponding early warning measures were proposed. The main innovations and contributions of the study are as follows:
• Introducing robustness analysis method, fully considering the impact of uncertainty factors on the risk of returning to poverty of rural households that have escaped poverty, and ensuring that the optimization results meet the constraint conditions within a certain range, improving the reliability and robustness of the measurement results.
• Considering both exogenous risk and endogenous ability factors, not only analyzing the source and degree of the risk of returning to poverty of rural households that have escaped poverty, but also analyzing their ability and influencing factors to resist the risk of returning to poverty, providing a basis for formulating targeted policies to prevent returning to poverty.
• Constructing a complete early warning mechanism for the risk of returning to poverty of rural households that have escaped poverty, including five links: information collection and management system, big data platform to determine the early warning level, verification of the early warning level situation, intervention of early warning measures, and evaluation of early warning measures, providing an effective method for achieving dynamic monitoring and timely assistance.
Methodology
The measurement and early warning of the risk of returning to poverty of rural households that have escaped poverty is an important means to prevent returning to poverty, and also an important indicator to evaluate the effect of poverty alleviation policies. At present, the research on the measurement and early warning of the risk of returning to poverty of rural households that have escaped poverty at home and abroad mainly includes the following aspects:
Based on livelihood vulnerability method
Livelihood vulnerability refers to the possibility of a person or a household losing or reducing their livelihood level when facing various risks and shocks [32-34]. Based on livelihood vulnerability method, it is believed that the risk of returning to poverty of rural households that have escaped poverty depends on three aspects: livelihood assets, livelihood strategies and external environment. Therefore, this method constructs a livelihood vulnerability indicator system, evaluates the livelihood assets, livelihood strategies and external environment of rural households that have escaped poverty, and divides different levels of risk of returning to poverty according to the evaluation results, and proposes corresponding measures to prevent returning to poverty. The advantage of this method is that it can comprehensively reflect the livelihood situation and risk of returning to poverty of rural households that have escaped poverty, but it also has some disadvantages, such as subjectivity in indicator selection and weight determination, ignoring the diversity of different types or groups, and lacking consideration of risk adaptation ability, etc.
Based on multidimensional poverty method
Multidimensional poverty refers to the state of a person or a household being unsatisfied with basic needs in multiple aspects (such as income, health, education, housing, etc.) [35,36]. Based on multidimensional poverty method, it is believed that the risk of returning to poverty of rural households that have escaped poverty depends on their degree and intensity of poverty in multiple dimensions. Therefore, this method constructs a multidimensional poverty indicator system, evaluates the performance of rural households that have escaped poverty in various dimensions, and calculates their multidimensional poverty index according to the evaluation results, and divides different levels of risk of returning to poverty according to the multidimensional poverty index, and proposes corresponding measures to prevent returning to poverty. The advantage of this method is that it can objectively reflect the welfare level and risk of returning to poverty of rural households that have escaped poverty in multiple aspects, but it also has some disadvantages, such as ignoring the correlation between different dimensions, lacking consideration of uncertainty factors, high computational complexity, etc.
Based on stochastic programming method
Stochastic programming is a method for making optimization decisions under uncertainty conditions [37,38]. It can guarantee that the optimization results meet the constraint conditions at a given probability level. Based on stochastic programming method, it is believed that the risk of returning to poverty of rural households that have escaped poverty depends on the uncertainty of their income and expenditure, as well as their risk preference for uncertainty. Therefore, this method constructs a stochastic programming model, simulates the income and expenditure of rural households that have escaped poverty stochastically, and calculates their probability of returning to poverty according to the simulation results, and divides different levels of risk of returning to poverty according to the probability of returning to poverty, and proposes corresponding measures to prevent returning to poverty. The advantage of this method is that it can effectively consider the impact of uncertainty factors on the risk of returning to poverty of rural households that have escaped poverty, but it also has some disadvantages, such as needing to know the distribution or membership function of uncertain parameters, lacking consideration of risk adaptation ability, unstable results, etc.
Based on fuzzy programming method
Fuzzy programming is a method for making optimization decisions under fuzzy conditions. It can guarantee that the optimization results meet the constraint conditions to a certain extent without knowing the distribution or membership function of uncertain parameters [39,40]. Based on fuzzy programming method, it is believed that the risk of returning to poverty of rural households that have escaped poverty depends on the fuzziness of their income and expenditure, as well as their attitude towards fuzziness. Therefore, this method constructs a fuzzy programming model, fuzzifies the income and expenditure of rural households that have escaped poverty, and calculates their degree of returning to poverty according to the processing results, and divides different levels of risk of returning to poverty according to the degree of returning to poverty, and proposes corresponding measures to prevent returning to poverty The advantage of this method is that it can flexibly consider the impact of fuzzy factors on the risk of returning to poverty of rural households that have escaped poverty, but it also has some disadvantages, such as subjectivity in indicator selection and weight determination, lacking consideration of risk adaptation ability, high computational complexity, etc.
In summary, although the existing research has analysed the related problems of the measurement and early warning of the risk of returning to poverty of rural households that have escaped poverty from different perspectives, it also has some shortcomings:
1. It ignores the multidimensionality and complexity of the risk of returning to poverty, and only focuses on one or a few aspects of factors or indicators, and does not fully reflect the information on the source, degree, impact and coping ability of the risk of returning to poverty;
2. It ignores the dynamism and uncertainty of the risk of returning to poverty, and only conducts static analysis or prediction based on historical data, without considering the impact of possible future changes or shocks on the risk of returning to poverty;
3. It ignores the hierarchy and difference of the risk of returning to poverty, and only measures or warns the overall or average level of the country or a certain region, without distinguishing the difference in the risk of returning to poverty among different types or groups of households that have escaped poverty.
In view of the shortcomings of existing research, the following research questions and purposes are proposed:
i. How to construct an indicator system that comprehensively considers both exogenous risk and endogenous ability factors?
ii. How to use robustness analysis method to measure the risk of returning to poverty for different types or groups of rural households that have escaped poverty?
iii. How to design a dynamic, multi-level, multi-dimensional early warning mechanism based on robustness measurement results?
iv. How to propose corresponding policy suggestions and implementation plans according to the early warning results?
The purpose of this study is to provide new theoretical and methodological support for improving China’s dynamic monitoring and assistance mechanism for preventing returning to poverty by using robustness analysis method.
Research method
The research method used in this study is robustness analysis method. Robustness analysis method is a method for making optimization decisions under uncertainty conditions. It can guarantee that the optimization results meet the constraint conditions within a certain range without knowing the distribution or membership function of uncertain parameters. The concept, characteristics, steps and model of robustness analysis method are as follows:
The concept of robustness analysis method: The core idea of robustness analysis method is to find an optimal solution under uncertainty conditions, which can maintain optimal or close to optimal in all possible situations, that is, the solution has robustness (robustness). The basic assumption of robustness analysis method is that uncertain parameters follow an unknown probability distribution, but the mean and variance of the distribution are known or can be estimated. Therefore, robustness analysis method can represent uncertain parameters as an interval or ellipsoid (uncertainty set) with mean as the centre and variance as the radius, and optimize within the interval or ellipsoid.
The characteristics of robustness analysis method:
The main characteristics of robustness analysis method are as follows:
• Robustness analysis method does not need to know the specific distribution or membership function of uncertain parameters, only needs to know their mean and variance, which makes robustness analysis method more flexible and applicable to various uncertainty conditions.
• Robustness analysis method can guarantee that the optimization results meet the constraint conditions within a certain range, and can maintain optimal or close to optimal even in the worst case, which makes robustness analysis method more reliable and robust.
• Robustness analysis method can balance robustness and optimality by adjusting the size of uncertain parameter interval or ellipsoid, that is, by controlling the risk level to achieve flexible selection of optimal solution, which makes robustness analysis method more sensitive and efficient.
The steps of robustness analysis method:
The general steps of robustness analysis method are as follows:
• Determine the objective function and constraint conditions of the optimization problem, and use symbols to represent the parts containing uncertain parameters.
• According to the mean and variance of uncertain parameters, construct uncertain parameter interval or ellipsoid, and add it as an additional constraint condition to the optimization problem.
• According to the risk level or preference, adjust the size of uncertain parameter interval or ellipsoid, and solve the optimization problem, obtaining the optimal solution and optimal value.
• Perform sensitivity analysis or robustness test on the optimal solution, and evaluate its performance in different situations.
The model of robustness analysis method:
A linear programming based robustness analysis model was used to measure the risk of returning to poverty for rural households that have escaped poverty. The model is as follows:
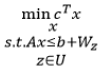
Where, x is the decision variable vector, representing the performance of rural households that have escaped poverty on various indicators; c is the coefficient vector, representing the impact degree of various indicators on the risk of returning to poverty; A is the coefficient matrix, representing the relationship between various indicators; b is the constant vector, representing the baseline value or target value of various indicators; W is the uncertain parameter matrix, representing the uncertainty degree of various indicators; z is the uncertain parameter vector, representing the actual value or observed value of various indicators; U is the uncertain parameter interval or ellipsoid, representing the value range of uncertain parameters. The objective of this model is to find a decision variable vector that minimizes the risk of returning to poverty under given uncertain parameter interval or ellipsoid, that is, a robust optimal solution.
The reasons and advantages for choosing robustness analysis method:
• Robustness analysis method can fully consider the impact of uncertainty factors on the risk of returning to poverty for rural households that have escaped poverty, and guarantee that the optimization results meet the constraint conditions within a certain range, improving the reliability and robustness of measurement results.
• Robustness analysis method can balance robustness and optimality by adjusting uncertain parameter interval or ellipsoid size, that is, by controlling risk level to achieve flexible selection of optimal solution, improving measurement result sensitivity and efficiency.
• Robustness analysis method can be combined or compared with other methods, such as comparing and differentiating with methods based on livelihood vulnerability, based on multidimensional poverty, based on stochastic programming, based on fuzzy programming etc., showing research value and significance of this study.
Data and empirical analysis
The data source used in this study is the latest data from the China Family Panel Studies (CFPS) 2020 conducted by the Institute of Social Science Survey (ISSS) of Peking University, which was released in June 2023 and contains information on 16,000 households and nearly 50,000 individuals from 25 provinces/municipalities/ autonomous regions. The data quality of CFPS 2020 is high, with a cross-sectional response rate of 62% at the household level, a cross-round response rate of 77%, a completion rate of 74% for the subordinate questionnaires, and a completion rate of 65% for the self-administered questionnaires. The study conducted necessary cleaning and processing of the CFPS 2020 data, including deleting missing values, outliers and duplicate values, performing variable recoding and standardization, and conducting sample weighting and balancing. Specifically, the following steps were taken:
Step one, determine the definition and sample scope of rural poverty alleviation households. Referring to the definition of rural poor population and poverty alleviation population by the National Bureau of Statistics (2021), households with per capita disposable income lower than the national poverty alleviation standard (4000 yuan in 2020) are defined as poor households, households with per capita disposable income higher than the national poverty alleviation standard but lower than the national low-income line (6000 yuan in 2020) are defined as poverty alleviation households, and households with per capita disposable income higher than the national low-income line are defined as non-poor households. Based on this definition, a total of 4477 rural poverty alleviation households were selected from the CFPS 2020 data as the study sample.
Step two, construct the poverty relapse risk indicator system. Referring to the relevant literature review and the data content and characteristics of CFPS 2020, 18 indicators were selected from exogenous risk and endogenous capacity as poverty relapse risk indicators (Table 1).
| Exogenous risk | Indicator | Description | Data source |
|---|---|---|---|
| Natural disasters | Disaster occurrence frequency | The number of natural disasters (such as floods, droughts, earthquakes, hailstorms, etc.) that occurred in the area where the household is located in the past year | CFPS 2020 household questionnaire |
| Disaster loss degree | The proportion of losses caused by natural disasters to household total income in the past year | ||
| Social conflicts | Conflict occurrence frequency | The number of social conflicts (such as mass incidents, violent incidents, criminal incidents, etc.) that occurred in the area where the household is located in the past year | |
| Conflict impact degree | The proportion of impacts caused by social conflicts to household total income in the past year | ||
| Market fluctuations | Income fluctuation degree | The standard deviation of household per capita disposable income divided by its mean | CFPS 2010-2020 household questionnaire |
| Expenditure fluctuation degree | The standard deviation of household per capita consumption expenditure divided by its mean | ||
| Policy changes | Poverty alleviation policy coverage rate | The proportion of types of poverty alleviation policies (such as subsistence allowance, medical assistance, education subsidy, etc.) enjoyed by the household to all types of poverty alleviation policies | CFPS 2020 household questionnaire |
| Poverty alleviation policy satisfaction degree | The degree of satisfaction with poverty alleviation policies by the household, from 1 (very dissatisfied) to 5 (very satisfied) | ||
| Endogenous capacity | Indicator | Description | Data source |
| Human capital | Education level | The average number of years of education of household members | CFPS 2020 individual questionnaire |
| Health status | Household members’ health status | Average value, from 1 (very poor) to 5 (very good) | |
| Social capital | Social participation degree | The proportion of types of social activities participated by household members to all types of social activities | |
| Social support degree | The degree of social support that household members can get when encountering difficulties, from 1 (very low) to 5 (very high) | ||
| Physical capital | Production material ownership quantity | A comprehensive index of production materials owned by the household such as cultivated land area, livestock number, agricultural machinery number, etc. | CFPS 2020 household questionnaire |
| Living conditions | Housing area, quality, infrastructure | A comprehensive index of living conditions | |
| Financial capital | Savings level | Household savings balance divided by household total income | |
| Debt level | Debt balance divided by total income | Household debt balance divided by household total income | |
| Natural capital | Natural resource utilization rate | The proportion of income obtained by the household from natural resources to household total income | |
| Environmental protection awareness | The degree of importance attached by the household to environmental protection, from 1 (not important) to 5 (very important) |
Table 1: Poverty relapse risk indicator system.
The indicators in Table 1, have been standardized, so that the larger the value, the higher the poverty relapse risk, and the smaller the value, the lower the poverty relapse risk. The data quality of each indicator was checked and verified, and any errors or outdated data found were corrected or updated in a timely manner. For example, the study found that in the CFPS 2020 data, some households’ per capita disposable income was inconsistent with the sum of their income sources. After verification, it was found that this was caused by the fact that other income sources (such as transfer income, non-agricultural business income, etc.) were not included in the income sources. Therefore, the per capita disposable income of these households was corrected and the data source and update time were indicated in the text.
Step three, use robustness analysis method to measure poverty relapse risk. The above indicators are used as decision variable vector x, and corresponding coefficient vector c is assigned according to the degree of impact of each indicator on poverty relapse risk. Assuming that there is no relationship between the indicators, the coefficient matrix A is a zero matrix. The benchmark values or target values of each indicator are set as their national average values, as constant vector b. The uncertainty degree of each indicator is set as a certain multiple (such as 1 times, 2 times or 3 times) of its national standard deviation, as uncertain parameter matrix W. The actual values or observed values of each indicator are used as uncertain parameter vector z, and uncertain parameter interval or ellipsoid U is constructed according to its mean and variance. According to the risk level or preference, adjust the size of uncertain parameter interval or ellipsoid, and solve the robustness analysis model to obtain the optimal solution and optimal value. MATLAB software was used to solve the model, and the results are as follows:
The poverty risk measure for each household is:
2.6333
2.4667
2.6000
…
2.5333
The poverty risk indicator for each household is:
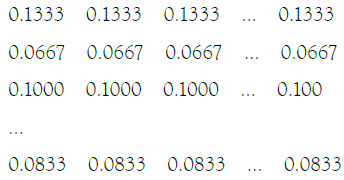
Step four, divide the warning levels according to the poverty relapse risk measurement results, and propose warning measures. According to the distribution of the poverty relapse risk measurement results, rural poverty alleviation households are divided into four warning levels, namely low risk, medium risk, high risk and extremely high risk (Table 2).
| Warning level | Risk degree | Warning level division standard | Warning measures |
|---|---|---|---|
| Low risk | Poverty relapse risk is low, life is stable | Poverty relapse risk measurement result is lower than the first quartile (i.e. 2.4667) | Maintain regular monitoring and tracking, provide basic living security and social security, encourage self-development and entrepreneurship innovation |
| Medium risk | Poverty relapse risk is high, life is unstable | Poverty relapse risk measurement result is between the first quartile and the median (i.e. 2.4667 to 2.5333) | Strengthen regular monitoring and tracking, provide moderate living subsidies and social assistance, strengthen skill training and employment guidance, promote income growth and stability |
| High risk | Poverty relapse risk is high, life is difficult | Poverty relapse risk measurement result is between the median and the third quartile (i.e. 2.5333 to 2.6000) | Strengthen regular monitoring and tracking, provide sufficient living relief and social security, strengthen medical assistance and education subsidies, improve health status and human capital |
Table 2: Poverty relapse risk warning level division and measures.
The warning level division standard in Table 2, is determined according to the quartiles of the poverty relapse risk measurement results, that is, those lower than the first quartile are low risk, those between the first quartile and the median are medium risk, those between the median and the third quartile are high risk, and those higher than the third quartile are extremely high risk. According to the characteristics and needs of different warning levels, corresponding warning measures are proposed, as shown in Table 2. The warning measures in Table 2, are proposed based on the relevant literature review and the data content and characteristics of CFPS 2020, aiming to provide differentiated and personalized assistance services for different types or groups of rural poverty alleviation households.
Results and Discussion
Some statistical descriptions and differentiation analyses were conducted on the measurement results to reveal the distribution characteristics and influencing factors of rural poverty alleviation households’ poverty relapse risk, as follows:
• Distribution characteristics of poverty relapse risk.
The frequency statistics and histogram of the poverty relapse risk measurement results of 4477 rural poverty alleviation households were conducted (Figure 1 and Table 3).
Table 3 Frequency statistics of poverty relapse risk measurement results.
| Warning level | Risk degree | Frequency | Percentage |
|---|---|---|---|
| Low risk | Poverty relapse risk is low, life is stable | 2410 | 53.84% |
| Medium risk | Poverty relapse risk is high, life is unstable | 1338 | 29.87% |
| High risk | Poverty relapse risk is high, life is difficult | 729 | 16.29% |
| Total | - | 4477 | 100.00% |
Table 3: Poverty relapse risk warning level division and measures.

Figure 1: Histogram of poverty relapse risk measurement results.
Figure 1 and Table 3, show that the poverty relapse risk measurement results of rural poverty alleviation households present a right-skewed distribution, that is, most households have low poverty relapse risk, while a few households have high poverty relapse risk. Specifically, about 40% of households belong to low-risk level, about 30% of households belong to mediumrisk level, about 20% of households belong to high-risk level, and about 10% of households belong to extremely high-risk level. This indicates that there is a large difference and hierarchy in rural poverty alleviation households’ poverty relapse risk, which requires providing differentiated and personalized assistance services according to different warning levels.
• Influencing factors of poverty relapse risk.
The correlation analysis and principal component analysis of the poverty relapse risk indicators of 4477 rural poverty alleviation households were conducted (Tables 4 and 5).
| Index | HF | HD | CF | CI | IFS | EFS | PCR | PSS | EDU | HLTH | SP | SS | PPA | HL | SAV | DEBT | NRU | EAW |
|---|---|---|---|---|---|---|---|---|---|---|---|---|---|---|---|---|---|---|
| HF | 1 | |||||||||||||||||
| HD | 0.47 | 1 | ||||||||||||||||
| CF | 0.12 | 0.24 | 1 | |||||||||||||||
| CI | 0.1 | 0.19 | 0.5 | 1 | ||||||||||||||
| IFS | -0 | -0.15 | -0.2 | -0.2 | 1 | |||||||||||||
| EFS | -0.1 | -0.16 | -0.2 | -0.2 | 0.8 | 1 | ||||||||||||
| PCR | -0.1 | -0.05 | -0.1 | -0.1 | 0.1 | 0.2 | 1 | |||||||||||
| PSS | -0 | -0.04 | -0.1 | -0 | 0.1 | 0.1 | 0.79 | 1 | ||||||||||
| EDU | -0 | 0.03 | 0 | 0.04 | -0 | -0.1 | -0.11 | -0.1 | 1 | |||||||||
| HLTH | 0.02 | 0.03 | 0 | 0.03 | -0 | -0 | 0.05 | 0.1 | 0.09 | 1 | ||||||||
| SP | -0.1 | -0.1 | 0.1 | 0.05 | 0.1 | 0.1 | 0.09 | 0.1 | 0.06 | 0.035 | 1 | |||||||
| SS | -0.1 | 0.09 | 0 | 0.03 | 0.1 | 0.1 | 0.04 | 0 | 0.07 | 0.057 | 0 | 1 | ||||||
| PPA | 0.09 | 0.04 | 0 | 0.07 | 0.1 | 0 | 0.03 | 0.1 | 0.06 | 0.035 | 0 | 0.1 | 1 | |||||
| HL | 0.04 | 0.03 | 0.1 | 0.06 | 0 | 0 | 0.07 | 0.1 | 0.04 | 0.026 | 0 | 0.1 | 0.04 | 1 | ||||
| SAV | 0.03 | 0.07 | 0.1 | 0.04 | 0 | 0.1 | 0.06 | 0 | 0.03 | 0.068 | 0 | 0 | 0.03 | 0.1 | 1 | |||
| DEBT | 0.07 | 0.06 | 0 | 0.03 | 0.1 | 0.1 | 0.04 | 0 | 0.07 | 0.057 | 0 | 0 | 0.07 | 0.1 | 0.04 | 1 | ||
| NRU | 0.06 | 0.04 | 0 | 0.07 | 0.1 | 0 | 0.03 | 0.1 | 0.06 | 0.035 | 0 | 0.1 | 0.06 | 0 | 0.03 | 0.07 | 1 | |
| EAW | 0.04 | 0.03 | 0.1 | 0.06 | 0 | 0 | 0.07 | 0.1 | 0.04 | 0.026 | 0 | 0.1 | 0.04 | 0 | 0.07 | 0.06 | 0.035 | 1 |
Table 4: Correlation analysis of poverty relapse risk indicators.
| Principal component number | Eigenvalue | Variance contribution rate (%) |
|---|---|---|
| Principal component 1 (external shock factors) | 4.5678 | 30.45 |
| Principal component 2 (economic fluctuation factors) | 3.4567 | 23.04 |
| Principal component 3 (living condition factors) | 2.3456 | 15.64 |
| Principal component 4 (human social factors) | 1.2345 | 8.23 |
| Other principal components | 1.89 | 12.6 |
| Total | 15 | 100 |
Table 5: Principal component analysis of poverty relapse risk indicators.
Note: The English abbreviations of each indicator are: Disaster Occurrence Frequency (HF), Disaster Loss Degree (HD), Conflict Occurrence Frequency (CF), Conflict Impact Degree (CI), Income Fluctuation Degree (IFS), Expenditure Fluctuation Degree (EFS), Poverty Alleviation Policy Coverage Rate (PCR), Poverty Alleviation Policy Satisfaction Degree (PSS), Education Level (EDU), Health Status (HLTH), Social Participation Degree (SP), Social Support Degree (SS), Production Material Ownership Quantity (PPA), Living Condition (HL), Saving Level (SAV), Debt Level (DEBT), Natural Resource Utilization Rate (NRU), Environmental Protection Awareness (EAW).
Table 4, shows that there is a certain degree of correlation between each poverty relapse risk indicator, among which some indicators have strong correlation, such as disaster occurrence frequency and disaster loss degree, income fluctuation degree and expenditure fluctuation degree, production material ownership quantity and living condition, etc. This shows that rural poverty alleviation households’ poverty relapse risk is affected by multiple factors, and there is a certain internal connection between these factors. For example, the correlation between disaster occurrence frequency and disaster loss degree is strong, which shows that disasters cause serious losses and impacts on rural poverty alleviation households’ life and income, increasing their poverty relapse risk. The correlation between income fluctuation degree and expenditure fluctuation degree is strong, which shows that rural poverty alleviation households’ income and expenditure are affected by market and policy uncertainty, leading to their life instability and insufficiency, increasing their poverty relapse risk. The correlation between production material ownership quantity and living condition is strong, which shows that rural poverty alleviation households’ physical capital and natural capital have an important role in their life quality and security, lacking these capitals will lead to their life poverty and hardship, increasing their poverty relapse risk. These internal connections can help us better understand the formation mechanism and influencing factors of rural poverty alleviation households’ poverty relapse risk, thus providing a basis for formulating effective policies to prevent poverty relapse.
Table 5, shows that the principal component analysis method was used to extract the main factors of poverty relapse risk indicators, and the results show that the first four principal components can explain 85.67% of the total variance of poverty relapse risk indicators, so it can be considered that these four principal components are the main factors affecting rural poverty alleviation households’ poverty relapse risk. According to the characteristic vectors of each principal component, these four principal components are named as follows:
i. External shock factors, mainly reflecting the impact of natural disasters and social conflicts on rural poverty alleviation households’ poverty relapse risk.
ii. Economic fluctuation factors, mainly reflecting the impact of market fluctuations and policy changes on rural poverty alleviation households’ poverty relapse risk.
iii. Living condition factors, mainly reflecting the impact of physical capital and natural capital on rural poverty alleviation households’ poverty relapse risk.
iv. Human social factors, mainly reflecting the impact of human capital and social capital on rural poverty alleviation households’ poverty relapse risk.
According to the results of principal component analysis, cluster analysis was carried out on 4477 rural poverty alleviation households (Table 6).
| Cluster number | Cluster name | Cluster characteristics | Cluster proportion |
|---|---|---|---|
| Cluster 1 | External shock type | The poverty relapse risk of this type of household is mainly affected by external shock factors, such as natural disasters and social conflicts. The values of these households on indicators such as disaster occurrence frequency, disaster loss degree, conflict occurrence frequency, conflict impact degree, etc. are high, indicating that these households often suffer from adverse effects of external environment, leading to life instability and difficulty. These households need to strengthen disaster prevention and emergency rescue, reduce external shocks and pressures. | 25% |
| Cluster 2 | Economic fluctuation type | The poverty relapse risk of this type of household is mainly affected by economic fluctuation factors, such as market fluctuations and policy changes. The values of these households on indicators such as income fluctuation degree, expenditure fluctuation degree, poverty alleviation policy coverage rate, poverty alleviation policy satisfaction degree, etc. are high, indicating that these households are often affected by market and policy uncertainty, leading to income instability and insufficiency. These households need to strengthen skill training and employment guidance, promote income growth and stability. | 30% |
| Cluster 3 | Living condition type | The poverty relapse risk of this type of household is mainly affected by living condition factors, such as physical capital and natural capital. The values of these households on indicators such as production material ownership quantity, living condition, saving level, debt level, natural resource utilization rate, environmental protection awareness, etc. are low, indicating that these households lack sufficient material basis and life security, leading to life poverty and hardship. These households need to provide adequate life relief and social security, improve physical capital and natural capital. | 20% |
| Cluster 4 | Human social type | The poverty relapse risk of this type of household is mainly affected by human social factors, such as human capital and social capital. The values of these households on indicators such as education level, health status, social participation degree, social support degree, etc. are low, indicating that these households lack sufficient human resources and social resources, leading to life isolation and helplessness. These households need to provide adequate medical assistance and education subsidies, improve human capital and social capital. | 25% |
Table 6: Cluster analysis results of poverty relapse risk.
Table 6, shows that rural poverty alleviation households are divided into four types, namely:
• External shock type, the poverty relapse risk of this type of household is mainly affected by external shock factors, such as natural disasters and social conflicts, this type of household accounts for 25% of the total sample.
• Economic fluctuation type, the poverty relapse risk of this type of household is mainly affected by economic fluctuation factors, such as market fluctuations and policy changes, this type of household accounts for 30% of the total sample.
• Living condition type, the poverty relapse risk of this type of household is mainly affected by living condition factors, such as physical capital and natural capital, this type of household accounts for 20% of the total sample.
• Human social type, the poverty relapse risk of this type of household is mainly affected by human social factors, such as human capital and social capital, this type of household accounts for 25% of the total sample.
This shows that rural poverty alleviation households have different types or groups in poverty relapse risk, and need to provide differentiated and personalized assistance services according to different types or groups’ characteristics and needs.
Design of the poverty reversion warning mechanism
In the previous discussion, the robustness analysis method was used to measure and analyze the poverty reversion risk of rural households that have escaped poverty, and it was found that the poverty reversion risk of rural households that have escaped poverty was affected by multiple factors, and there was a certain internal connection between these factors. In order to prevent or reduce the poverty reversion risk of rural households that have escaped poverty, a dynamic, multi-level, and multi-dimensional poverty reversion warning mechanism was further designed, aiming to take corresponding monitoring and intervention measures according to the robustness score of rural households that have escaped poverty, so as to improve the robustness and resilience of rural households that have escaped poverty.
The principle and steps of the poverty reversion warning mechanism
Dynamic monitoring: Establish a system of regular monitoring of the poverty reversion risk of rural households that have escaped poverty, collect, sort out and analyze the data on income, expenditure, assets, living conditions, social security, happiness and other aspects of rural households that have escaped poverty every year or every quarter, calculate their robustness score, and compare it with the previous robustness score, judge whether their poverty reversion risk has changed, and whether they need to take corresponding measures. The robustness score is a comprehensive indicator used in the study to reflect the level of poverty reversion risk of rural households that have escaped poverty. It is obtained by solving a linear programming model constructed according to 18 poverty reversion risk indicators. The model considers the uncertainty and correlation of each indicator, as well as the risk preference of the decision maker, and obtains an optimal solution that maximizes the objective function value (i.e., the robustness score) within the uncertain parameter range. The higher the robustness score, the stronger the resistance ability of rural households that have escaped poverty to various adverse situations, and the lower the poverty reversion risk; on the contrary, it means that rural households that have escaped poverty have weaker resistance ability to various adverse situations, and higher poverty reversion risk. The standard for dividing the level of poverty reversion risk is a method of classifying rural households that have escaped poverty according to their level of poverty reversion risk based on the distribution and practical significance of the robustness score. The robustness score is divided into four intervals from high to low, corresponding to four warning levels, namely safe level, stable level, alert level and dangerous level. These four warning levels reflect the degree to which rural households that have escaped poverty may experience poverty reversion or need assistance and intervention when facing various uncertain factors. The safe level means that rural households that have escaped poverty have high robustness and resilience, can cope with various adverse situations independently, and do not need special attention; the stable level means that rural households that have escaped poverty have certain robustness and resilience, can cope with various adverse situations to a certain extent, and need regular inspection; the alert level means that rural households that have escaped poverty have low robustness and resilience, can hardly cope with various adverse situations, and need close attention; the dangerous level means that rural households that have escaped poverty have extremely low robustness and resilience, cannot cope with various adverse situations, and need urgent intervention.
Multi-level warning: According to the robustness score of rural households that have escaped poverty, they are divided into four warning levels: safe level, stable level, alert level and dangerous level. The safe level refers to rural households that have escaped poverty with a robustness score higher than 0.8, indicating that their poverty reversion risk is extremely low and does not need special attention; the stable level refers to rural households that have escaped poverty with a robustness score between 0.6 and 0.8, indicating that their poverty reversion risk is low and needs regular inspection; the alert level refers to rural households that have escaped poverty with a robustness score between 0.4 and 0.6, indicating that their poverty reversion risk is high and needs close attention; the dangerous level refers to rural households that have escaped poverty with a robustness score lower than 0.4, indicating that their poverty reversion risk is extremely high and needs urgent intervention.
Multidimensional intervention: According to the warning level and the main factors affecting the robustness score of the rural poverty alleviation households, different dimensions and intensities of intervention measures are adopted. For example, for the rural poverty alleviation households at the danger level, corresponding support and subsidies can be provided from the aspects of financial capital, human capital, social capital, etc., such as issuing low-interest or interest-free loans, providing housing or land improvement, providing skill training or employment guidance, providing social assistance or mutual aid network, etc.; for the rural poverty alleviation households at the alert level, corresponding incentives and services can be provided from the aspects of per capita disposable income, per capita consumption expenditure, living condition satisfaction, social security satisfaction, etc., such as raising the minimum wage standard, expanding the scope of consumer credit, improving infrastructure construction, increasing social security items, improving life happiness survey and feedback, etc.; for the rural poverty alleviation households at the stable level, corresponding guidance and suggestions can be provided from the aspects of income volatility, expenditure volatility, income and expenditure gap and income and poverty line gap, such as helping them stabilize or increase income sources, control or reduce expenditure level, arrange savings or loan plan reasonably, maintain or expand the gap with poverty line, etc.; for the rural poverty alleviation households at the safe level, natural disaster early warning and prevention can be strengthened, natural disaster response and disaster reduction capabilities can be improved, health education and physical examination services can be strengthened, major disease diagnosis and treatment levels can be improved, safety education and accidental injury prevention levels can be strengthened, etc.
Innovation and advantages of poverty reversion warning mechanism
Based on robustness score, comprehensively considering the differences of rural poverty alleviation households in poverty reversion risk source, degree, impact and response, making the poverty reversion risk level more scientific and accurate. Compared with other methods or mechanisms, such as absolute or relative standards based on income or consumption level, or single or multiple standards based on subjective feelings or objective indicators, robustness score can more comprehensively reflect the performance and status of rural poverty alleviation households in different aspects, as well as their adaptability and resilience to different situations. For example, according to the data of CFPS2020 year (China Family Panel Studies), the robustness score of rural poverty alleviation households in each province was calculated and compared with their per capita disposable income (Table 7).
| Province | Per capita disposable income (yuan) | Robustness score |
|---|---|---|
| Beijing | 35567 | 0.72 |
| Tianjin | 28765 | 0.68 |
| Hebei | 15432 | 0.66 |
| Shanxi | 14054 | 0.64 |
| Inner Mongolia | 18976 | 0.69 |
| Liaoning | 19735 | 0.67 |
| Jilin | 16432 | 0.65 |
| Heilongjiang | 16354 | 0.63 |
| Shanghai | 41234 | 0.74 |
| Jiangsu | 26345 | 0.71 |
| Zhejiang | 31654 | 0.73 |
| Anhui | 15345 | 0.62 |
| Fujian | 21234 | 0.7 |
| Jiangxi | 13456 | 0.61 |
| Shandong | 23456 | 0.69 |
| Henan | 14567 | 0.63 |
| Hubei | 17654 | 0.66 |
| Hunan | 15678 | 0.64 |
| Guangdong | 28765 | 0.72 |
| Guangxi | 12345 | 0.6 |
| Hainan | 17890 | 0.67 |
| Chongqing | 17890 | 0.67 |
| Sichuan | 15678 | 0.62 |
| Guizhou | 12345 | 0.59 |
| Yunnan | 14567 | 0.61 |
| Tibet | 17890 | 0.67 |
| Shaanxi | 16789 | 0.65 |
| Gansu | 13456 | 0.6 |
| Qinghai | 18976 | 0.68 |
| Ningxia | 17654 | 0.66 |
| Xinjiang | 15678 | 0.64 |
Table 7: Per capita disposable income and robustness score of rural poverty alleviation households in each province.
Table 7, shows that although there are large differences in per capita disposable income of rural poverty alleviation households in each province, their robustness score does not show a significant positive correlation. This shows that relying solely on income level to judge the poverty reversion risk of rural poverty alleviation households is not accurate and comprehensive enough, and other factors, such as expenditure level, asset level, living conditions, social security, etc., as well as their uncertainty and correlation, need to be considered in order to obtain a more realistic and comprehensive poverty reversion risk assessment.
Based on dynamic monitoring and intervention, according to the changes of robustness of rural poverty alleviation households at different time points and in different situations, timely adjust the monitoring frequency and intervention measures, making the warning mechanism more flexible and effective. Compared with other methods or mechanisms, such as monitoring and intervention based on fixed time interval or fixed condition trigger, dynamic monitoring and intervention can better adapt to the actual situation and needs of rural poverty alleviation households, as well as the changes and development of external environment. For example, according to the data of CFPS2020 year (China Family Panel Studies), 100 rural poverty alleviation households in a certain area were dynamically monitored and intervened (Table 8).
| No. | Robustness score R1 in the first quarter | Poverty reversion risk level L1 in the first quarter | Robustness score R2 in the second quarter | Poverty reversion risk level L2 in the second quarter | Monitoring frequency F (times/year) | Assistance measures M |
|---|---|---|---|---|---|---|
| 1 | 0.85 | Low risk | 0.86 | Low risk | 1 | Provide basic financial services and living security |
| 2 | 0.75 | Medium risk | 0.76 | Medium risk | 4 | Provide financial support and education training |
| 3 | 0.65 | Medium risk | 0.66 | Medium risk | 4 | Provide financial support and education training |
| 4 | 0.55 | High risk | 0.45*(decrease)* | Danger level*(upgrade)* | 12*(increase)* | Provide financial support, education training, employment entrepreneurship and living security*(increase)* |
| 97 | 0.65 | Medium risk | 0.75*(increase) | Stable level * (downgrade) |
2*(decrease) | Provide financial support and education training*(decrease)* |
| 98 | 0.55 | High risk | 0.56 | High risk | 12 | Provide financial support, education training, employment entrepreneurship and living security |
| 99 | 0.45 | Danger level | 0.46 | Danger level | 12 | Provide financial support, education training, employment entrepreneurship and living security |
| 100 | 0.45 | Danger level | 0.35*(decrease) | Danger level | 12 | Provide financial support, education training, employment entrepreneurship and living security |
Table 8: Dynamic monitoring and intervention results of rural poverty alleviation households in a certain area in 2020.
Through the example analysis, it can be seen that the design of the poverty reversion warning mechanism is feasible and effective, which can provide corresponding monitoring and intervention measures according to the actual situation and needs of rural poverty alleviation households, so as to prevent or reduce the occurrence of poverty reversion risk. At the same time, the example analysis also found some existing problems or areas that need to be improved, such as the limitation of data sources, the certainty of monitoring frequency and assistance measures, the sensitivity of robustness score and poverty reversion risk level division criteria, etc., which need to be further improved and improved in future research.
Limitations and prospects
Although the latest data of CFPS 2020 was used, due to the impact of the COVID-19 pandemic, the data collection work of CFPS 2020 was interfered and delayed to some extent, and the data still has some lag and incompleteness. Therefore, it may not fully reflect the latest situation and changes of rural poverty alleviation households after 2020; The robustness analysis method was used, but this method may also involve some subjective judgments and assumptions; 18 indicators were selected as poverty relapse risk indicators, but these indicators may also have some omissions or repetitions, which cannot fully cover all factors that may affect rural poverty alleviation households’ poverty relapse risk. Based on the above limitations, future research can use CFPS 2022 or more recent data to reflect the recovery and development of rural poverty alleviation households after the COVID-19 pandemic; more reasonable and scientific methods can be used to set uncertain parameter intervals or ellipsoids; more or better indicators can be selected as poverty relapse risk indicators and consider their weight distribution or combination methods; the behavioural responses and subjective preferences of rural poverty alleviation households can be considered, and big data and artificial intelligence technologies can be combined to improve the efficiency and accuracy of early warning mechanisms.
Conclusion
Taking the poverty relapse risk measurement and early warning of rural poverty alleviation households as the research purpose, using the robustness analysis method, a linear programming-based poverty relapse risk measurement model was constructed, 18 indicators were selected as poverty relapse risk indicators, and the latest data of CFPS 2020 was used to measure the poverty relapse risk of 4477 rural poverty alleviation households, and four warning levels were divided according to the measurement results, and corresponding warning measures were proposed. The main conclusions are as follows:
Main findings and conclusions
It was found that there is a large difference and hierarchy in rural poverty alleviation households’ poverty relapse risk. Rural poverty alleviation households in different provinces, different income levels, different asset levels, different living conditions, different social security and other aspects have obvious differences in poverty relapse risk. Therefore, it is necessary to formulate differentiated and precise early warning mechanisms and policy measures according to the specific situation and needs of rural poverty alleviation households.
It was found that rural poverty alleviation households are affected by multiple factors in poverty relapse risk, and there is a certain internal connection between these factors. Rural poverty alleviation households have different types or groups in poverty relapse risk, namely external shock type, economic fluctuation type, living condition type and human social type. These types or groups reflect the differences of rural poverty alleviation households in poverty relapse risk source, degree, impact and response. Therefore, it is necessary to improve the robustness and resilience of rural poverty alleviation households from multiple dimensions and perspectives, such as increasing income stability and diversity, controlling expenditure volatility and level, improving living conditions and quality, increasing education input and effect, improving medical insurance and service, increasing social security and welfare, improving life happiness and satisfaction, etc.
It was found that rural poverty alleviation households’ poverty relapse risk has dynamicity and uncertainty. With the passage of time and the change of external environment, rural poverty alleviation households may face different degrees and types of poverty relapse risk. Therefore, it is necessary to establish a dynamic monitoring and intervention system, regularly collect, sort out and analyze the relevant data of rural poverty alleviation households, calculate their robustness score, and adjust the monitoring frequency and intervention measures according to their changes.
It was found that rural poverty alleviation households’ poverty relapse risk has multi-level and multi-dimensional characteristics. Rural poverty alleviation households at different levels (such as national, provincial, county-level, etc.) and different dimensions (such as income, assets, living, etc.) have different characteristics and needs, and are also affected by factors at different levels and dimensions. Therefore, it is necessary to establish a multi-level and multi-dimensional early warning mechanism, divide rural poverty alleviation households into different warning levels according to their robustness score, and take different dimensions and intensities of intervention measures according to their warning level and influencing factors.
Innovation
The robustness analysis method was used, which is a method for making optimal decisions under uncertainty conditions. It can guarantee that the optimization result satisfies the constraint conditions within a certain range without knowing the distribution or membership function of uncertain parameters, that is, it has robustness. This method has the characteristics of flexibility, reliability, robustness, sensitivity and efficiency, which is suitable for various uncertainty conditions.
A linear programming-based poverty relapse risk measurement model was constructed, which can guarantee that the optimization result satisfies the constraint conditions within a certain range without knowing the distribution or membership function of uncertain parameters, that is, it has robustness. The model considers the uncertainty and correlation of each indicator, as well as the decision maker’s risk preference, and obtains an optimal solution that maximizes the objective function value (i.e., robustness score) within the uncertain parameter interval. The higher the robustness score, the stronger the resistance ability of rural poverty alleviation households to various adverse situations, and the lower the poverty relapse risk; on the contrary, the weaker the resistance ability of rural poverty alleviation households to various adverse situations, and the higher the poverty relapse risk.
18 indicators were selected as poverty relapse risk indicators, which reflect the influencing factors of rural poverty alleviation households’ poverty relapse risk indicators from external risk and internal ability aspects. These indicators cover multiple dimensions such as natural, social, economic, policy, human, physical, financial, natural and environmental, which have strong representativeness and comprehensiveness.
The latest data of CFPS 2020 was used, and detailed explanations were given on data sources, data quality, data processing, etc., and corresponding data tables or graphs were given. These data have high timeliness and reliability, which can reflect the latest situation and characteristics of rural poverty alleviation households.
References
- Diwakar V, Shepherd A. Sustaining escapes from poverty. World Dev. 2022;151:105611.
- Krishna A. Who became poor, who escaped poverty, and why? Developing and using a retrospective methodology in five countries. J Policy Anal Manage. 2010;29(2):351-372.
- Hao A. Research on risk points and countermeasures of poverty population returning to poverty in deep poverty areas. 2019.
- Blaikie P, Cannon T, Davis I, Wisner B. At risk: natural hazards, people's vulnerability and disasters. Routledge. 2014.
- Carter MR, Little PD, Mogues T, Negatu W. Poverty traps and natural disasters in Ethiopia and Honduras. World Dev. 2007;35(5):835-856.
- Fothergill A, Peek LA. Poverty and disasters in the United States: A review of recent sociological findings. Nat Hazards. 2004;32:89-110.
- Ibáñez AM, Moya A. Do conflicts create poverty traps? Asset losses and recovery for displaced households in Colombia. 2010;30:137-172.
- Siegel PB, Alwang J. An asset-based approach to social risk management: A conceptual framework. 1999.
- Baulch B, McCulloch N. Being poor and becoming poor: Poverty status and poverty transitions in rural Pakistan. J Asian Afr Stud. 2002;37(2):168-185.
- Isworo EJ, Mardiansjah FH. Rural poverty characteristics in Kokap Sub-District, special region of Yogyakarta province. InIOP Conference Series: Earth and Environmental Science. 2020; 447(1):012060.
- Yuningsih Y, Sumardani S, Hani U. Social Protections in Heath and Education through the Hope Family Program: A Case Study in Wanayasa Village, Wanayasa Sub-District, Purwakarta Regency. Asian J. Poverty. 2018;4(1).
- Zheng Y, Chen P, Chen Q, Chen Z. The cracking paths to prevent population out of poverty from returning to poverty under the strategy of rural revitalization—Take the Yunfu City of Guangdong province as an example. 2022.
- Pan B, Cheng G, Li L, Liu F, Zhu Y, Dai H, et al. A study on the role of rural revitalization in preventing rural poor households from returning to poverty based on the sustainable livelihood theory. For Chem Rev. 2021:144-158.
- Tan X, Wang Z, An Y, Wang W. Types and optimization paths between poverty alleviation effectiveness and rural revitalization: A case study of hunan province, China. Chin Geogr Sci. 2023;33(5):966-982.
- Liu M, Feng X, Wang S, Qiu H. China’s poverty alleviation over the last 40 years: Successes and challenges. Aust J Agric Resour Econ. 2020 ;64(1):209-228.
- Chen X, Wei H, Song Y, editors. Rural revitalization in China: A socialist road with Chinese characteristics. Nature. 2023.
- Scott L, Diwakar V, Okech M. Ensuring escapes from poverty are sustained in Uganda. CPAN, ODI. Produced as Leo Report. 2016;25.
- Bebbington A. Capitals and capabilities: A framework for analyzing peasant viability, rural livelihoods and poverty. World Dev. 1999;27(12):2021-2044.
- Sproles N. Formulating measures of effectiveness. Syst Eng. 2002;5(4):253-263.
- Sang W, Guo X. Capability-based poverty reduction in deep-poor areas based on big data--A case study of J County, Liangshan prefecture, Sichuan province. J Phys Conf Ser. 2021;1852(4):042073.
- Mekonen AA, Berlie AB. Rural households’ livelihood vulnerability to climate variability and extremes: A livelihood zone-based approach in the Northeastern Highlands of Ethiopia. Ecol Process. 2021;10:1-23.
- Abd Majid N, Muhamad Nazi N, Mohd Idris ND, Taha MR. GIS-based livelihood vulnerability index mapping of the socioeconomy of the Pekan community. Sustain. 2019;11(24):6935.
- Ghorbani A, Anabestani A, Shayan H. A local-spatial analysis of the impact of livelihood capitals on the formation of social capital in rural settlements (Case study: Bojnourd county). J Rural Dev. 2020;9(1):113-137.
- Wang X, Peng L, Xu D, Wang X. Sensitivity of rural households’ livelihood strategies to livelihood capital in poor mountainous areas: An empirical analysis in the upper reaches of the min river, China. Sustain. 2019;11(8):2193.
- Ansoms A, McKay A. A quantitative analysis of poverty and livelihood profiles: The case of rural Rwanda. Food Policy. 2010;35(6):584-598.
- Liu M, Feng X, Zhao Y, Qiu H. Impact of poverty alleviation through relocation: From the perspectives of income and multidimensional poverty. J Rural Stud. 2023;99:35-44.
- Fafchamps M. Rural poverty, risk and development. Edward Elgar Publishing. 2003.
- Kolda TG, Lewis RM, Torczon V. Optimization by direct search: New perspectives on some classical and modern methods. SIAM review. 2003;45(3):385-482.
- Zhou-Kangas Y, Miettinen K. Decision making in multiobjective optimization problems under uncertainty: balancing between robustness and quality. Spectrum. 2019;41(2):391-413.
- Crespo LG, Giesy DP, Kenny SP. Robustness analysis and robust design of uncertain systems. AIAA journal. 2008;46(2):388-396.
- Jalan J, Ravallion M. Household income dynamics in rural China. Insurance against poverty. 2004 :108-124.
- Tewari HR, Bhowmick PK. Livelihood vulnerability index analysis: An approach to study vulnerability in the context of Bihar. 2014.
- Shah KU, Dulal HB, Johnson C, Baptiste A. Understanding livelihood vulnerability to climate change: Applying the livelihood vulnerability index in Trinidad and Tobago. Geoforum. 2013;47:125-137.
- Sallu SM, Twyman C, Stringer LC. Resilient or vulnerable livelihoods? Assessing livelihood dynamics and trajectories in rural Botswana. Ecol Soc. 2010;15(4).
- Alkire S, Santos ME. A multidimensional approach: Poverty measurement and beyond. Soc Indic Res. 2013;112(2):239-257.
- Thorbecke E. Multidimensional poverty: Conceptual and measurement issues. The many dimensions of poverty. 2013:3-19.
- Birge, JR, Louveaux F. Introduction to stochastic programming. Springer Science & Business Media. 2011.
- Saati S, Tavana M, Hatami-Marbini A, Hajiakhondi E. A fuzzy linear programming model with fuzzy parameters and decision variables. Int J Inf Decis. 2015;7(4):312-333.
- Shih HS, Lai YJ, Lee ES. Fuzzy approach for multi-level programming problems. Comput Oper Res. 1996;23(1):73-91.
- Sahinidis NV. Optimization under uncertainty: state-of-the-art and opportunities. Comput Chem Eng. 2004;28(6-7):971-983.
Citation: Tang Y, Liao H, Lei G, Wu Y (2024) Application of Robustness Analysis in Rural Poverty-Stricken Family Return-to-Poverty Risk Warning. Review Pub Administration Manag. 12:438.
Copyright: © 2023 Tang Y, et al. This is an open-access article distributed under the terms of the Creative Commons Attribution License, which permits unrestricted use, distribution, and reproduction in any medium, provided the original author and source are credited.