Indexed In
- Open J Gate
- RefSeek
- Hamdard University
- EBSCO A-Z
- OCLC- WorldCat
- Publons
- International Scientific Indexing
- Euro Pub
- Google Scholar
Useful Links
Share This Page
Journal Flyer

Open Access Journals
- Agri and Aquaculture
- Biochemistry
- Bioinformatics & Systems Biology
- Business & Management
- Chemistry
- Clinical Sciences
- Engineering
- Food & Nutrition
- General Science
- Genetics & Molecular Biology
- Immunology & Microbiology
- Medical Sciences
- Neuroscience & Psychology
- Nursing & Health Care
- Pharmaceutical Sciences
Research - (2023) Volume 12, Issue 1
Application of Landsat 8 Aquatic Reflectance Band Data to Analyze Variations in Chlorophyll a, Suspended Sediment, N, and P in Coastal Estuaries of Southern Louisiana
Christopher Potter*Received: 17-Jan-2023, Manuscript No. JGRS-23-19609; Editor assigned: 20-Jan-2023, Pre QC No. JGRS-23-19609 (PQ); Reviewed: 03-Feb-2023, QC No. JGRS-23-19609; Revised: 09-Feb-2023, Manuscript No. JGRS-23-19609 (R); Published: 17-Feb-2023, DOI: 10.35248/2469-4134.23.12.271
Abstract
Nutrient enrichment of estuaries is a proven causal agent of harmful algal blooms, fish kills, and hypoxic zones. To enable regional mapping in coastal estuaries of southern Louisiana of Chlorophyll a (Chl-a), suspended sediment, Nitrogen and Phosphorus (N and P) concentrations, monthly water sample data collected at over 30 stations along a 129 km transect in the Barataria Basin were correlated with Landsat 8 Aquatic Reflectance (AR) Band 4 (Red) image data acquired from 2013 to 2016. Analysis showed significant non-linear correlations of Landsat Aquatic Reflectance (AR) Band 4 values with measured concentrations of Chlorophyll a, total suspended sediment, N, and P. The strongest correlations were revealed between Landsat AR Band 4 reflectances and total P concentrations, periodically at R2 values >0.6. Landsat AR band images revealed detailed variations in total N and P concentrations that were consistent with the measured nutrient declines associated with dilution of freshwater as sampling locations progressed toward more coastal saline waters.
Keywords
Barataria basin; Landsat; Chlorophyll; Suspended sediment; Hurricane Ida
INTRODUCTION
Widespread alternations in coastal wetland area and estuarine water quality makes the Mississippi River Delta on the southern coast of Louisiana one of the most rapidly changing environments in the world [1,2]. The main cause of wetland loss has been historical reduction of sediment inputs from the Mississippi River, which has come under extensive flood control by the construction of levees [3, 4]. Additional interacting agents of Louisiana coastal change have been frequent hurricanes, wave-driven erosion, saltwater intrusion, subsidence, compaction, eutrophication, invasive species, gas and oil well drilling, canal construction, and sea-level rise.
Previous research has demonstrated strong linkages between riverine loadings of elevated Nitrogen and Phosphate (N and P) and the concentration of Chlorophyll (Chl-a) pigments in a variety of coastal water bodies [5,6]. Nutrient enrichment of coastal estuaries on the Gulf of Mexico can lead to sudden algal blooms and the potential development large-scale hypoxic (bottom-water oxygen deficiency) zones [7,8]. Nitrogen concentration variations along salinity gradients from freshwater to open Gulf waters can nonetheless exhibit a significant decline in nutrient concentrations, lower than that expected merely by seawater dilution, due in part to rapid denitrification [9].
The Barataria Basin in southeastern Louisiana is one of the nation’s most productive estuaries for fisheries and seafood. The basin is bounded on the north and east sides by man-made levees along the Mississippi River, to the west by Bayou Lafourche, and to the south by several barrier islands and the Gulf of Mexico. Barataria Bay has several tidal inlets, including Barataria Pass between the Grand Isle and Grand Terre Island with a width of about 600 m. A notable freshwater source to the upper Barataria Basin is Mississippi River water pumped through the man‐made Davis Pond Diversion facility, operational since 2002 with a capacity of around 250 m3 s-1 (10,650 cfs or 302 cms) [10]. These authors added that the flushing of coastal Louisiana bays in the winter is largely controlled by cold fronts formed by large‐scale weather systems that occur at 3–7 day intervals.
In a long-term water sampling study throughout Barataria Basin estuaries and lakes, reported that the average Secchi Disk (SD) depth (to measure light penetration) was 0.4-m in the middle of Barataria Bay, and increased to its maximum of near 1-m in Lake Salvador to the north [11]. Since TSS concentrations were inversely related to SD depth measurements in their methodology, light penetration into surface waters of Lake Salvador was generally lowest and measured TSS concentrations were frequently the highest (> 35 mg L-1) in this water body, compared to all other transect sampling locations of [11]. The concentration of Chl-a was reported to rise and fall coincidentally with the concentration of TN along the more freshwater northern half of their boat sampling transect.
Detailed mapping of seasonal variations in suspended sediment, nutrient concentrations, and phytoplankton growth patterns is a necessary but, as of yet, largely unmet objective of Gulf Coast research. Analysis of regional imagery data from the Sentinel satellite sensors has been used in a number of other coastal estuaries to map the variability of suspended sediment and Chl-a concentrations in time and space [12-14]. The purpose of the present study was to associate in the same manner and for the first time, new Landsat ar image products to spatial variations in Chl-a, suspended sediment, N, and P in coastal estuaries of southern Louisiana. Working together, the Landsat 8 and 9 sensors are collecting images every week of these coastal environments.
Study area description
The 6,600 km2 Barataria Basin and its watersheds are located adjacent to the west bank of the Mississippi River in southeastern Louisiana and the Gulf of Mexico. The major water bodies of the basin include the northern freshwater Lac des Allemands, the mid-basin Lake Salvador and Little Lake, and Barataria Bay at the southern margin. The average water depth across this basin is 1.5 m and is normally unstratified. High levels of Particulate Organic Carbon (POC) and Particulate Organic Nitrogen (PON), along with phytoplankton biomass, have been well-documented in estuaries of the Barataria Basin bordering the western levee of the Mississippi River, especially during high flow conditions when river water is diverted into Lake Pontchartrain and other estuaries [15]. A notable factor contributing to the high phytoplankton biomass in this estuary is the elevated nutrient loading from agricultural land use that can influence the growth of blue-green N-fixing algae [11].
Methodology
Landsat aquatic reflectance products
In 2020, the United States Geological Survey (USGS) released the Landsat 8 Provisional Aquatic Reflectance (L8PAR) Product [16]. This provisional image collection for the retrieval of water-leaving reflectance was initially validated using coastal waters spectra from the Ocean Color Aerosol Robotic Network (OC-AERONET) [17]. Calibration and evaluation of the L8PAR product over highly turbid and eutrophic inland water bodies is an ongoing research requirement.
L8PAR products (from 2013 to 2021) have been generated from the L8SR algorithm, a method that uses the scene center for the sun angle calculation and then hard-codes the view zenith angle to 0. The solar zenith and view zenith angles are used for calculations as part of the atmospheric correction. L8PAR products are derived from Top of Atmosphere (TOA) reflectance images and auxiliary atmospheric data, which are input to atmospheric correction algorithms to retrieve the water-leaving radiance at visible wavelengths (Red-Green-Blue; RGB) [16]. Application of the Bidirectional Reflectance Distribution Function (BRDF) produces the RGB reflectance bands for the upper part of the water column. All cloud-free L8PAR products acquired in 2013-2016 over the study area were downloaded from the USGS Earth Explorer application and extracted from the Aquatic Reflectance (AR) band 3 (Green) and band 4 (Red) image layers at water sampling locations in the Barataria Basin.
Water sampling data
Usage small boats to collect surface water samples (at 0.5 m depths) from 1994 to 2016 at 37 stations located along a transect of the Barataria Basin aligned in a southeast to northwest direction (Figure 1) [11]. Monthly water samples collected along this estuary transect were used to determine the total and dissolved forms of N and P that were coincidentally measured with turbidity, suspended sediments, Chl-a concentration, and other parameters. Water sampling started after daybreak at 1 km offshore of Grand Isle, continued northward through the Barataria Waterway into Little Lake, into Bayou Perot to Lake Salvador, into to Lac des Allemands and then into Bayou Chevreuil, where each sampling trip was terminated.
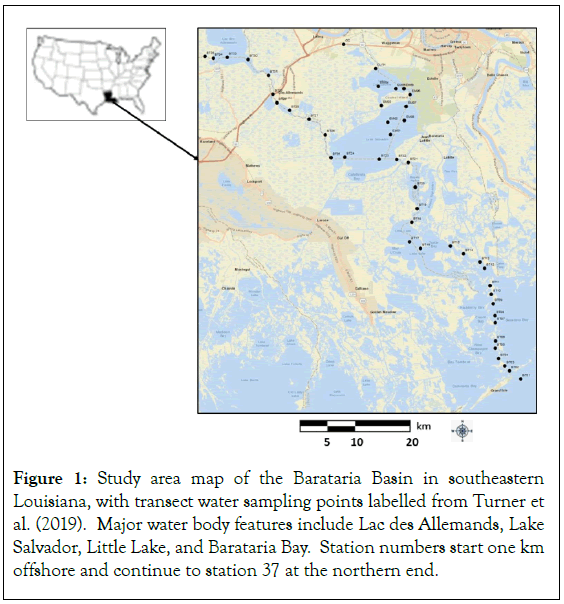
Figure 1: Study area map of the Barataria Basin in southeastern Louisiana, with transect water sampling points labelled from Turner et al. (2019). Major water body features include Lac des Allemands, Lake Salvador, Little Lake, and Barataria Bay. Station numbers start one km offshore and continue to station 37 at the northern end.
Statistical analysis
To quantify potential non-linear relationships between Landsat reflectance values collected on relatively cloud-free acquisition dates and water quality concentration datasets (from the closest corresponding sample dates and always within 7 days between Landsat overpass and water sampling dates) along the boat transects conducted, regression analysis was carried out using a 2nd-order polynomial function [11,18]. This regression model can be expressed as:

Where Y is the measured water constituent concentration, X is the Landsat band reflectance value, and a, b, and c are slope coefficients. For each image date, the regression model result was expressed as the R2 coefficient of determination statistic, a common goodness-of-fit measure for regression models. This statistic indicates the percentage of the variance in the dependent variable (Y) that the independent variable (X) explains, on a 0–1 scale.
Results
Water sample to landsat data comparisons and correlations
The patterns in reflectance values across in Landsat AR Band 4 images were found to be visually consistent with most variations and major water body differences measured in TSS, Chl-a, and P concentrations in boat transects from 2013 to 2016 [11]. Specifically, TSS concentrations along the boat sampling transect were frequently measured as the highest in Lake Salvador and in Little Lake, which is likewise represented as high reflectance values in these lakes in the example Landsat image. Furthermore, concentrations of TN and TP reported were measured to decline rapidly in water leaving the freshwater Lac des Allemands, again declined markedly in bayous entering into Little Lake, and then declined gradually with increasing salinity until entering Barataria Bay; this same pattern of TN/TP changes is likewise represented as a gradient of low to high reflectance values in the example Landsat image of (Figure 2) [11].

Figure 2: Landsat AR Band 4 image example for the study area from Dec 2013. Note:  High Value: 6500,
  Low Value: 0.
Applying regression analysis, significant (p<0.1) non-linear correlations of Landsat AR Band 4 values were regularly derived from the closest dates sampled for surface water concentrations of TSS, TP and Chl-a [11]. Concentrations of TSS were positively correlated with Band 4 values, where TP and Chl-a concentrations were negatively correlated with Band 4 values. The coefficient of determination (R2) value for each of the 11 Landsat-to-water concentration regression model dates were generally highest for predicting TP and Chl-a levels across the water sampling transect. It should be mentioned that regression analysis results were consistently not significant (p<0.1) for correlations of Landsat AR Band 3 (Green) values derived from data values from the closest dates sampled for surface water concentrations of TSS, TP and Chl-a [11] (Figure 3).

Figure 3: Regression correlation results of Landsat ar Band 4 values at the closest dates sampled by Turner et al. (2019) for surface water concentrations of TSS, TP and Chl-a.
Focus on lake salvador and little lake water quality assessment
To better illustrate the utility of Landsat AR image data for water quality assessments, two large lakes connected to upper Barataria Bay were selected for more focused analysis-Lake Salvador is a shallow water body near Lafitte, LA, fed in part by Bayou Des Allemands, with an average depth of about 1.8 m. It measures approximately 26 km long and 19 km wide, and is surrounded on all sides by marshlands. Water flows out of Lake Salvador through the Bayou Perot and into the more brackish Little Lake, 12 km to the south, past a large oil and gas field. Little Lake measures approximately 11 km long and 7 km wide (Figure 4).
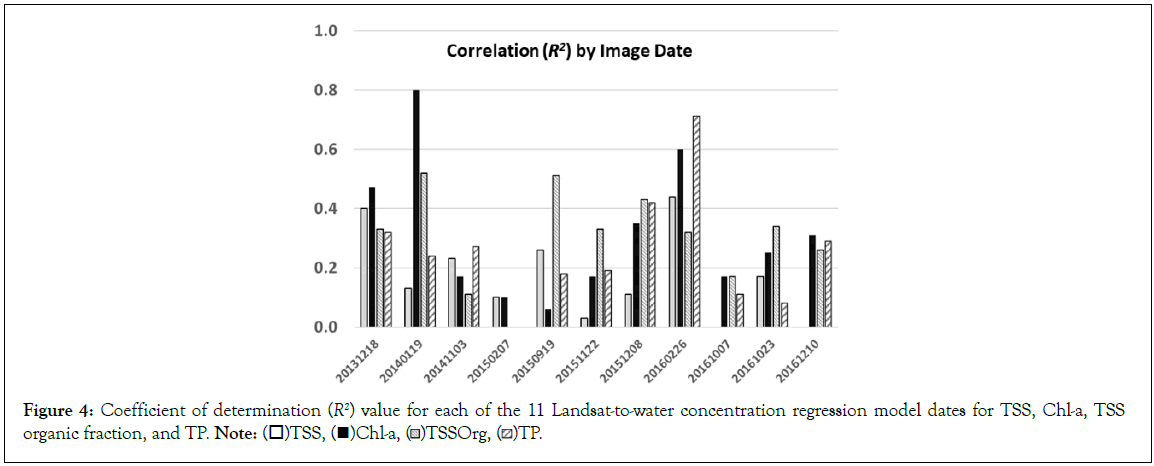
Figure 4: Coefficient of determination (R2) value for each of the 11 Landsat-to-water concentration regression model dates for TSS, Chl-a, TSS
organic fraction, and TP. Note:  TP.
TP.
Landsat AR Band 4 images centered on Lake Salvador and Little Lake from the years 2013 to 2021 showed a consistent temporal pattern from season to season, as follows: Band 4 reflectance was consistently high in images acquired in winter months (Dec- Jan), highest in images of spring (Mar-Apr) months, and lower in images in the fall (Aug-Oct) months. This variation pattern over the seasons generally followed large river stages and flow rates in the region. High Band 4 reflectance values were detected in the Mississippi River in winter and spring images and low Band 4 reflectance values were detected in the Mississippi River in fall images (Figure 5).

Figure 5: Landsat AR Band 4 images centered on Lake Salvador and Little Lake from the years 2013 to 2019. Note:  Low Value: 0.
Sampling station data was next used to verify these patterns seen in the time series of Landsat AR Band 4 images [11]. The plots of monthly TSS data at stations BT23 and BT17, sampled in Lake Salvador and Little Lake (respectively) strongly supported the above-mentioned Band 4 image temporal patterns. Measured TSS was consistently high in winter (Dec-Jan), highest in spring (Mar-Apr), and lower in fall (Aug-Oct). Measured Chl-a and TP concentrations were consistently highest in spring (Mar-Apr), high in fall (Aug- Oct), and lower in winter (Dec-Jan), a pattern which more closely reflects phases in the local agriculture growing season, rather than the river stages (Figure 6).
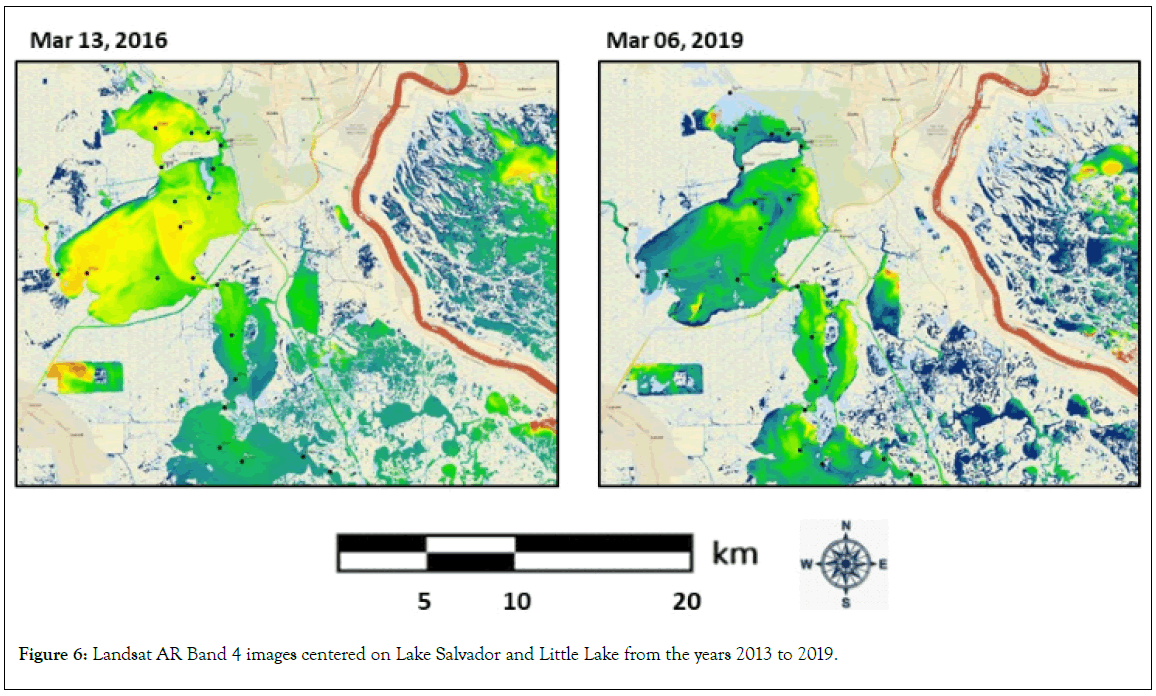
Figure 6: Landsat AR Band 4 images centered on Lake Salvador and Little Lake from the years 2013 to 2019.
Details of TSS transport into and out of small water bodies can be effectively inferred from Landsat AR Band 4 image comparisons, such as the one for Lake Salvador. In January of 2014, TSS levels in the Lake were measured at among their highest levels in years [11]. The Landsat Band 4 reflectance map for January 9, 2014 indicated exceptionally high levels of TSS in Lake Cataouatche to the north of Lake Salvador and flowing through Bayou Couba into the center-eastern section of the Lake. Discharge of high TSS laden water flow could be observed into Bayou Perot to the south of the Lake. Catahoula Bay in the southwestern corner of the Lake appeared to be entrapping markedly high levels of TSS as well. Meanwhile, the western section of the Lake, being fed by consistent freshwater flows from Bayou des Allemands, was observed with far less TSS loading in the Lake waters (Figure 7a).
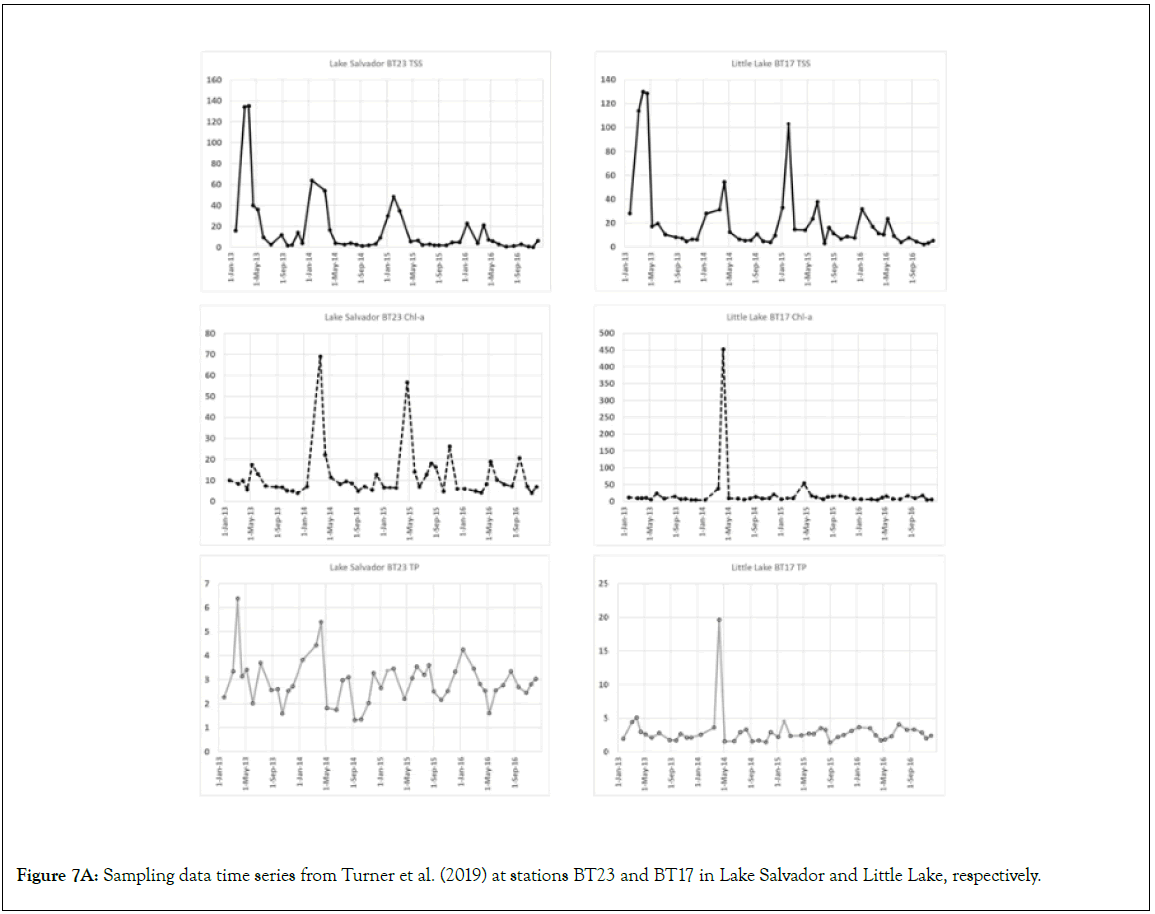
Figure 7A: Sampling data time series from Turner et al. (2019) at stations BT23 and BT17 in Lake Salvador and Little Lake, respectively.
In contrast, in September of 2015, TSS levels in the Lake were measured at among their lowest levels in years [11]. The Landsat Band 4 reflectance map for September 19, 2015 indicated only moderate levels of TSS in Lake Cataouatche, flowing weakly through Bayou Couba into the center-eastern section of the Lake. Discharge of low TSS level water flow could be observed into Bayou Perot to the south of the Lake. Catahoula Bay in the southwestern corner, Bayou des Allemands, and other shallow shorelines of the Lake were all observed with low TSS load in the waters. Based on this image comparison and supporting sampling data, it can be inferred that the drainages into Lake Cataouatche are a major source of sediment inputs to the upper Barataria Bay estuaries during winter and spring periods of high runoff (Figure 7b).

Figure 7B: Landsat AR Band 4 image comparisons for Lake Salvador. Note:  Low Value: 0.
It is worth mentioning that the Davis Pond sediment diversion project from the Mississippi River, just north of Lake Cataouatche, allows river water to periodically flow into the eastern end of Lake Salvador and then down into Little Lake. The inorganic P stocks in diversion-influenced areas of the pond water were nine times higher than those which remained isolated from riverine-diverted waters [19]. Their study implied that long-term addition of mineral sediments and inorganic P was not leading to notable negative impacts on the Davis Pond wetland. It is possible, however, that accumulated P could be slowly moving toward and into Lake Salvador from the Davis Pond sediment diversion in elevated flood and high-water release events.
Pre- and Post-hurricane ida image comparison
Satellite remote sensing of aquatic constituents at spatial resolutions of 30 × 30 m or less can uniquely offer valuable insights into the impacts of tropical storms on coastal ecosystems. Details of inundation patterns and increased sediment deposition after hurricanes into relatively small bayous, lakes, and bays can be discerned with Landsat image data. In this case, Landsat AR Band 4 images from just before and after Hurricane Ida (landfall in Barataria Bay on August 29, 2021) could be compared and analyzed (Figure 8).

Figure 8: Landsat AR Band 4 images from just before and after Hurricane Ida in August-September of 2021. Note:  Low Value: 0.
Hurricane Ida brought a Category 4 storm surge, high winds, and heavy rainfall to the southeastern LA coast and left over 1 million customers without power, including the entire city of New Orleans. The difference in Band 4 reflectance values between Landsat acquisition dates on August 18 and September 03, 2021 indicated that large amounts of suspended sediment were transported into Little Lake and Bayou Perot during the storm surge. Other wetland areas that were inundated with elevated sediment-laden floodwaters were in (from west to east): Bay Tambour, Bay Batiste, Round Lake, and Point a la Hache.
Discussion
An analysis of Landsat aquatic reflectance images acquired since 2013 over the Barataria Basin estuaries and lakes on the Louisiana Gulf Coast was presented in this study, including correlation results to relate reflectance values to a monthly water quality data set sampled along a transect from freshwater lakes and bayous to the Gulf of Mexico [11]. Strong correlation relationships were found between Band 4 (Red) reflectance data from the Landsat images and TSS, TP, and Chl-a concentrations measured along the sampling transect. The main finding from this study is that Landsat ar Band 4 patterns in the Barataria Basin and Breton Sound were consistent with measured nutrient and Chl-a declines associated with lower influence of freshwater inputs, from coastal estuaries moving toward more saline Gulf waters.
There are numerous reasons why the correlation R2 results for Band 4 (Red) reflectance values versus estuary/lake water constituent concentrations were found to be variable over time. These factors include variable wind speeds and directions over the water surfaces, tidal stage, time of the day that transect samples were taken, and sun angle changes over different times of the year. Given all these possible confounding factors, and the fact that Landsat pixels size is 30 × 30 m (much larger than a boat sample area), some variability in R2 values for each of the 11 Landsat-to-water concentration regression model dates would not be unexpected.
Sources of nutrient loading to the lakes and bayous of this study area have been a topic of much debate and concern for decades, and it is well known that agro-chemical sources can introduce significant amounts of nutrients into a watershed [20]. The major factor contributing to the high phytoplankton biomass in the Barataria lakes and estuaries is this high nutrient loading from agricultural land use, and is sustained, in part, by the exchange of partially diluted Mississippi River water coming into the estuary from the southern direction [11]. These authors also speculated that the main form of N in lakes of the upper Barataria Basin was as organic N, rather than inorganic forms that can recycle quickly.
Further asserted that concentrations of Chl-a and TN in freshwater Lac des Allemands were found to be directly related to the concentration of P in water entering the lake from runoff [21]. Variations in the Chl-a concentration in Little Lake, 50 km downstream from Lac des Allemands, was also reported to be directly related to the annual use of P fertilizer in the surrounding agricultural drainages, but not to N fertilizer use. The N accumulation in Little Lake is limited mainly by the P concentration of freshwater runoff entering the lakes to the north [21]. These authors contended that more N accumulates in Little Lake than is denitrified or buried within it, and P concentration therein limits Chl-a levels and phytoplankton biomass growth.
While it is essential that these biogeochemical processes of nutrient cycling and estuary productivity be better understood and clarified, principally with more water and sediment sampling data, another perhaps just as valuable use of the datasets offered in has been to calibrate and validate satellite image reflectance images of water quality for the Barataria Basin and the Mississippi River Delta [11]. With such corroborated satellite image time-series, much additional detail can be extracted for potential sediment and nutrient transport pathways into and out of lakes and bayous of Barataria Bay. Landsat 8 and 9 sensors working in tandem should be able to provide a fairly clear image acquisition of the Basin each month going forward. Many impacts of future tropical storms can be quickly assessed, as was demonstrated in this study for Hurricane Ida.
The Davis Pond diversion project, located between the Mississippi River and Lake Cataouatche, was designed principally to mitigate saline water intrusion into the upper Barataria Basin. The river sediment deposition for new marshland building from the Davis Pond diversion has been limited by relatively low flow rates, and the design of ponding areas at the end of the basin-side access channel serves as a sediment trap to limit the escape of sand-size particles into the lakes beyond [22]. Nonetheless, based on the results from this first Landsat AR mapping of the study area, new insights can be offered with respect to the sources and transport pathways of suspended sediment in waters of the upper Barataria Basin. For instance, multi-year Landsat AR image comparisons imply that high input sources of sediment were often present, especially in spring months, in Lake Cataouatche, located just south of the Davis Pond diversion and just north of Lake Salvador, with its outlet water flowing through Bayou Couba into the upper Basin estuaries.
Corroborating these findings from Landsat image patterns, reported in sediment transport study of this same area that high amounts of amount of sediment (117,700 tons) were delivered to the Davis Pond wetlands in the spring months of 2015 under near maximum discharge rates of 10,000 cfs [23]. Less than half (44%) of the resulting sediment load was deposited in the ponding area northwest of Lake Cataouatche, while the remainder of the river sediment load under high discharge rates washed through the ponding area to downstream waters of the Barataria Basin [24]. In contrast, in the fall of 2015, water discharge from the Davis Pond diversion returned to a lower baseline rate of 1,000 cfs and sediment delivery dropped to one-third of what it had been in the spring (39,600 tons). Moreover, the slower water flow meant that 81% of the river sediment was retained in the diversion ponding area rather than into Lake Cataouatche.
Conclusion
In addition to the existing Davis Pond and Caernarvon diversions, new and larger diversion projects in the Barataria Basin will move sediment, nutrients, and fresh water from the Mississippi River to existing wetlands and bays in the upper Basin and should also enhance marsh creation projects further down in the river Delta. These projects will build and sustain wetland forests, freshwater and intermediate marshlands by increasing sediment input and freshwater flow into the estuaries. New diversion projects in the Mid-Barataria Basin and the Mid-Breton Sound are crucial to increase coastal wetland recovery from the past damage from oil and gas drilling and resiliency to future sea level rise and storm surges. Using Landsat satellite image data, changes in water quality along the entire southeastern Louisiana coast can be monitored every few weeks, and the impacts of new Mississippi River diversions projects assessed in near real-time.
Competing interests
The authors have no financial or non-financial interests that are directly or indirectly related to the work submitted for publication.
References
- Giosan L, Syvitski J, Constantinescu S, Day J. Climate change: Protect the world's deltas. Nature. 2014;516(7529):31-33.
- Potter C. Remote sensing of wetland area loss and gain in the western Barataria basin (Louisiana, USA) since Hurricane Katrina. J Coast Res. 2021;37(5):953-963.
- Day Jr JW, Boesch DF, Clairain EJ, Kemp GP, Laska SB, Mitsch WJ, et al. Restoration of the Mississippi Delta: lessons from hurricanes Katrina and Rita. Sci. 2007;315(5819):1679-1684.
- Kolker AS, Allison MA, Hameed S. An evaluation of subsidence rates and sea‐level variability in the northern Gulf of Mexico. Geophys Res Lett. 2011;38(21).
- Vollenweider RA. Advances in defining critical loading levels for phosphorus in lake eutrophication. Mem Ist Ital Idrobiol. 1976;33:53-58.
[Google Scholar] [PubMed]
- Roy ED, Nguyen NT, Bargu S, White JR. Internal loading of phosphorus from sediments of Lake Pontchartrain (Louisiana, USA) with implications for eutrophication. Hydrobiologia. 2012;684(1):69-82.
- Adhikari PL, White JR, Maiti K, Nguyen N. Phosphorus speciation and sedimentary phosphorus release from the Gulf of Mexico sediments: implication for hypoxia. Estuar Coast Shelf Sci. 2015;164:77-85.
- Rabalais NN, Turner RE. Gulf of Mexico hypoxia: past, present, and future. Limnol Oceanogr. 2019;28(4):117-124.
- Valiela I, Cole ML. Comparative evidence that salt marshes and mangroves may protect seagrass meadows from land-derived nitrogen loads. Ecosyst. 2002;5(1):92-102.
- Li C, White JR, Chen C, Lin H, Weeks E, Galvan K, et al. Summertime tidal flushing of Barataria Bay: Transports of water and suspended sediments. J Geophys Res Oceans. 2011;116(C4).
- Turner RE, Swenson EM, Milan CS, Lee JM. Spatial variations in Chlorophyll a, C, N, and P in a Louisiana estuary from 1994 to 2016. Hydrobiologia. 2019;834(1):131-144.
- Yadav S, Yamashiki Y, Susaki J, Yamashita Y, Ishikawa K. Chlorophyll estimation of lake water and coastal water using landsat-8 and sentinel-2a satellite. ISPRS Archives. 2019.
- Taylor NC, Kudela RM. Spatial Variability of Suspended Sediments in San Francisco Bay, California. Remote Sens. 2021;13(22):4625.
- Salama MS, Spaias L, Poser K, Peters S, Laanen M. Validation of Sentinel-2 (MSI) and Sentinel-3 (OLCI) water quality products in turbid estuaries using fixed monitoring stations. Front Remote Sens. 2022; 2:808287.
[Google Scholar] [PubMed]
- Wissel B, Gaçe A, Fry B. Tracing river influences on phytoplankton dynamics in two Louisiana estuaries. Ecology. 2005;86(10):2751-2762.
- United States Geological Survey (USGS). Landsat Provisional Aquatic Reflectance Product Guide, Sioux Falls, South Dakota, USA. 2020.
- Pahlevan N, Schott JR, Franz BA, Zibordi G, Markham B, Bailey S, et al. Landsat 8 remote sensing reflectance (Rrs) products: Evaluations, intercomparisons, and enhancements. Remote Sens Environ. 2017;190:289-301.
- Ostertagová E. Modelling using polynomial regression. Procedia Eng. 2012;48:500-506.
- Spera AC, White JR, Corstanje R. Influence of a freshwater river diversion on sedimentation and phosphorus status in a wetland receiving basin. Estuar Coast Shelf Sci. 2020;238:106728.
- Lindau CW, Delaune RD, Alford DP. Monitoring nitrogen pollution from sugarcane runoff using15N analysis. Wat Air and Soil Poll. 1997;98(3):389-399.
- Turner RE, Lee JM, Milan CS, Swenson EM. Phosphorus concentrations into a subtropical lake strongly influence nitrogen accumulation, nitrogen export, and Chl a concentrations. Hydrobiologia. 2021;848(20):4787-4800.
- Allison MA, Meselhe EA. The use of large water and sediment diversions in the lower Mississippi River (Louisiana) for coastal restoration. J Hydrol. 2010;387(3-4):346-360.
- Keogh ME, Kolker AS, Snedden GA, Renfro AA. Hydrodynamic controls on sediment retention in an emerging diversion-fed delta. Geomorphology. 2019;332:100-111.
- Turner RE, Baustian JJ, Swenson EM, Spicer JS. Wetland sedimentation from hurricanes Katrina and Rita. Sci. 2006;314(5798):449-452.
Citation: Potter C (2023) Application of Landsat 8 Aquatic Reflectance Band Data to Analyze Variations in Chlorophyll a, Suspended Sediment, N, and P in Coastal Estuaries of Southern Louisiana. J Remote Sens GIS. 12:271.
Copyright: © 2023 Potter C. This is an open-access article distributed under the terms of the Creative Commons Attribution License, which permits unrestricted use, distribution, and reproduction in any medium, provided the original author and source are credited.
