Indexed In
- Open J Gate
- RefSeek
- Hamdard University
- EBSCO A-Z
- OCLC- WorldCat
- Publons
- International Scientific Indexing
- Euro Pub
- Google Scholar
Useful Links
Share This Page
Journal Flyer

Open Access Journals
- Agri and Aquaculture
- Biochemistry
- Bioinformatics & Systems Biology
- Business & Management
- Chemistry
- Clinical Sciences
- Engineering
- Food & Nutrition
- General Science
- Genetics & Molecular Biology
- Immunology & Microbiology
- Medical Sciences
- Neuroscience & Psychology
- Nursing & Health Care
- Pharmaceutical Sciences
Review Article - (2021) Volume 10, Issue 6
Application of GIS in Land Evaluation and Development of Suitability Map for Capsicum Production in Nairobi Peri-Urban Counties
Gitari HI*, Raza MA, Kisaka OM, Elbeltagi A, Singh RJ, Soratto RP, Michelle AO and Danga B1Agricultural Engineering Department, Mansoura University, Mansoura 35516, Egypt
2Department of Agricultural Science, ICARIndian Institute of Soil and Water Conservation, Dehradun, India
3Department of Crop Science, São Paulo State University (UNESP), Botucatu, São Paulo, Brazil
Received: 11-Jun-2021 Published: 02-Jul-2021, DOI: 10.35248/2469-4134.21.10.290
Abstract
This study was carried out to determine the areas which are best suited for capsicum (Capsicum annuum L.) production in the peri-urban counties of Nairobi, Kenya. The study used a multi-criteria evaluation approach by applying the Analytic Hierarchy Process (AHP). Soil (pH, drainage, texture, and electrical conductivity), climate (temperature and rainfall), and topography (slope and elevation) were the main criteria selected from literature for the study. The AHP was used to determine the relevance of a criterion based on its cumulative weights as per the Saaty’s table. The cumulative weights were used to construct output maps using Quantum Geographic Information Software (QGIS) software. Crop suitability map was produced through overlaying of the different thematic maps and suitability levels were based on Food and Agriculture Organization (FAO) land suitability classification. The results showed that about 50% of land in Kiambu County, 8% in Kajiado County and 12% in Machakos County is suitable for capsicum production. The remaining areas were reported unsuitable for the production of the crop due to the presence of some limitations such as soil texture, soil pH, drainage and climate. The findings of this study will be useful to decision making and planning and for further studies./
Keywords
capsicum annuum; Land suitability analysis; AHP, GIS, Multi-criteria evaluation.
Introduction
Soils fertility as determined by nutrient distribution is considered to be one of the most important factors affecting productivity of crops such as capsicum (capsicum annuum L.). capsicum is among the first plants to be domesticated and is normally referred as chili pepper plant due to its spicy or pungency nature [1]. In Kenya, capsicum is a good source of income where it is both exported as well as consumed locally. It is very rich in nutrients and vitamin, and can be consumed raw as a salad or cooked. Being a high-value crop, its production has been decreasing over the last years. For instance, according to FAOSTAT, its production has been on the decline in Kenya since 2014 [2]. Specifically, in 2014, 2015, 2016 and 2017 the country’s capsicum production was 2219, 2805, 2481 and 2197 tons, respectively. This becomes a major concern that ought to be addressed given that majority of citizens depend on it [3].
Optimizing capsicum production is possible through sustainable farming, which entails cultivation of a crop in a conducive and favorable environment [2]. To practice this; crops need to be planted where they are most suited to grow. capsicum grows best in hot/warm regions such as Eastern and Coastal Kenya with altitudes of up-to 2000 m above the sea level with rainfall of between 600–1250 mm per annum. The crop can grow well in different soils; however, it prefers well-drained soils with an effective rooting depth of 400–700 mm, a soil pH of 5.5–6.8 and adequate supply of nutrients [4,5]. capsicum grown in loamy to sandy loamy soils with a soil electrical conductivity of <1000 μS cm-1 produces better yields [5]. Annual temperature requirement for optimal seed and fruit development of capsicum ranges from 25°C to 30°C and 18°C to 20°C during the day and night respectively [1]. Determining where capsicum is suited requires a detailed evaluation of land; such studies help match crop requirements with land qualities [6]. According to Kato, selecting suitable crops using computers have been done before with soil, climate, geological, and geomorphological conditions being used as determining factors [7].
Geographic Information System (GIS) has been adopted by different sectors in national development but little has been done to support decisions for development in agriculture. Petja et al [8]. recommended the use of these technologies to improve quality of life. Previously, GIS has been applied under different scenarios. For instance, [2] Ashraf assessed the suitability of growing wheat (Triticum aestivum L.) using multi-criteria evaluation (MCE) and GIS. It provided information that helped farmers select their cropping patterns. Stickler et al. (2007) produced maps that determined the production capabilities for soybean (Glycine max (L.) Merr.), sugarcane (Saccharum spp.), and oil palm (Elaeis guineensis Jacq.) [9]. Crop nutritional and ecological requirements were identified and the data was used to develop spatially explicit variables, which were used to determine suitable regions where the crops could be grown [1]. It has conducted crop suitability study for mapping of rice (Oryza sativa L.), cassava (Manihot esculenta (L.) Crantz), and yam (Dioscorea spp.) in Nigeria. In Philippines, [3] produced nutrient distribution and crop suitability maps for growth of rice, maize (Zea mays L.), coconut (Cocos nucifera L.), mango (Mangifera indica L.), bananas (Musa ssp.), and potatoes (Solanum tuberosum L.).
In Kenya, Mugo et al. (2016) used GIS to identify suitable land for green gram (Vigna radiata L.) production in Kitui. They found out that all lands in Kitui are suited for green gram production. Kuria et al. (2011) used GIS technology to assess if rice could be grown in Tana Delta; suitability map was prepared to identify the various areas of suitability [10]. The study by Kihoro et al. (2013) investigated the suitability of growing rice in Mwea region using a MCE and GIS [11]. The result showed that 75% of the total land already under production of rice was highly suitable, and only 25% was ranked as being moderately suitable. In Nyandarua County, Kamau et al. (2015) determined potato suitability analysis using GIS and remote sensing. The results revealed that 38% of the agricultural land was best suited for growing potato with 51% and 11% being moderately and marginally suitable, respectively.
Nonetheless, little has been done in determining the suitability of growing capsicum in Kenya. To fill this gap, the current study evaluated land in Kiambu, Kajiado and Machakos counties for its suitability for capsicum production [12]. In an effort to apply GIS technology, the study aimed at assessing the suitability of growing capsicum based on critical factors considered to be affecting its growth. This was achieved by determining soil properties, climatic and topographic characters, and utilizing GIS tools in the production of output maps (soil fertility map and crop suitability maps). The study also involved the use of MCE approaches in GIS by applying Analytical Hierarchy Process (AHP) where various suitability criteria chosen for the study were assessed and grouped according to their relevance in optimizing capsicum production [13-17].
Material and Methods
The study area
The study was conducted in three peri-urban counties of Nairobi (Kiambu, Kajiado, and Machakos Counties) (Figure 1). Kiambu County borders Nairobi to the North with a total area of 2,449 km²; it lies between latitude 1.12°S and 1.08°S, longitude of between 36.52°E and 37.33°E, and an altitude of between 1800 and 2100 m above the sea level. It falls in the upper midlands agro-ecological zone characterized as having medium potential for agricultural production [18]. It receives an average annual rainfall of 962 mm and an average temperature of 18.8°C. June and July are the coldest months while January–March and September– October are the hottest months. Acrisols, Alisols, Lixisols, and Luvisols are the dominant soils in Kiambu County; characterized by increased clay content in the sub soil, low water storage capacity and with poor structure [9].
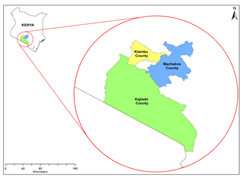
Figure 1:A map showing the counties where study was carried out: Kiambu, Kajiado, and Machakos.
Kajiado County borders Nairobi to the South with a total area of 21,292.7 km²; it lies between latitude 2.01°S and 2.15°S, longitude 36.02°E and 37.64°E, with altitudes of between 500 and 2500 m above the sea level. The climate in Kajiado County is characterized by steppe with an average annual rainfall of 500 mm and an average temperature of 18.9°C. Rainfall is mostly received in the month of April, with August being the driest month. It falls in the lowland’s midlands agro-ecological Zone [10]. Ferralsols, Vertisols, Cambisols, Leptosols and Acrisols are the main soils that dominate Kajiado County; characterized by uneven clay distribution with high sodium content [9].
On the other hand, Machakos County borders Nairobi to the West with a total area of 5,953 km²; it lies between latitude 1.35°S and 1.44°S, longitude of between 36.94°E and 37.80°E, and an altitude of between 1000 to 2100 m above sea level. It falls in the upper highlands agro-ecological zone hence classified as semi-arid [10]. It records an average annual rainfall of 830 mm and an average temperature of 19.0°C. The County is dominated by low fertile and easily erodible soils such as Alfisols, Ultisols, Oxisols, and L. ithic [4]. Each of the sub-counties within all the three was covered wholly or partially in the study.
Data collection
The methodology utilized for this study involved the collection of both primary (soil analysis data, from objective one) and secondary data (satellite imagery/climate data) (Table 1). Remote Sensing was used to generate satellite imagery as land use/land cover map and digital elevation model. GIS was used to integrate thematic maps, weighted percentages of the relevant criteria for the generation of soil fertility and crop suitability maps.
| Data Set | Format of the data | Data Source |
|---|---|---|
| Climate (temperature/rainfall) | Microsoft Excel | NASA website |
| Topography (slope/elevation) | Shape file | Digital Elevation Model (DEM) |
| Soil (drainage) | Shape file | Field test |
| Soil (texture, major and minor elements) | Microsoft Excel | Laboratory analysis |
| Satellite image (Landsat 8) | Tiff | USGS website |
| Soil sample sites | UTM coordinates | Kobo Collect |
| Administrative boundaries | Shape file | Survey of Kenya |
| NASA: National Aeronautics and Space Administration; UTM: Universal Transverse Mercator; USGS: United States Geological Survey; DEM: Digital Elevation Model MS Microsoft Excel. | ||
Table 1: Datasets for the study
Topography data were obtained from Kenya Agricultural and Livestock Research Institution (KALRO) and entered into Micro Soft (MS) Excel sheets. Land use map was produced through Landsat 8 Satellite imagery obtained from USGS (2020) [14]. Climate data (temperature and rainfall) were obtained from Kenya Meteorological Department (KMD). Climatic data were analysed using the spatial MCE model using GIS to produce an agro-climatic map.
The agro-climatic map was integrated with soil fertility map, crop nutrient data and biological data to produce a crop suitability map using Quantum Geographic Information System (QGIS) software. Suitability levels were based on FAO land suitability classification structure, which were ranked as S1 for highly suitable, S2 for moderately suitable, [15] S3 marginally suitable Soil texture Loamy Clayey Very clayey Extremely sandy Soil EC (μS cm-1) 0–800 μS/cm 800–1000 > 1000 Data management and analysis This Rainfall and temperature data obtained from the National Aeronautics and Space Administration (NASA) were entered into excel format file (NASA, 2020) [16]. Using MS excel, the data were cleaned to ensure that the values obtained are free from any obvious errors. The climate data was averaged for a given period and exported to QGIS software for further manipulation. Ordinary kriging, a geospatial method of interpolation was used to interpolate data points into a continuous surface. The final image produced was then clipped to the study areas by use of County boundaries. Land use map for the three counties was produced using Landsat 8 satellite. The Landsat 8 image for each County was procured from the United States Geological Survey website. The image was corrected for errors such as those arising from radiometric and atmospheric effects. Digital image processing was done using Environment for Visualizing Images 5 software, to improve identification of features and exported to QGIS software for supervised classification for identification of various land uses. Topography data was also entered in MS excel then exported to QGIS software to be interpolated through ordinary kringing to have a representation of elevation values for every study area. The resultant was a continuous surface, which formed a raster image. This was then clipped to the areas of study using the County administrative boundaries. Slope data were derived using the toolbox properties of the QGIS software. Soil pH was determined using a potentiometric method using a high impedance voltmeter on a soil suspension of 1:2 (soil: water) [8]. Electrical conductivity (EC) of the soil was determined using potentiometric method, made with a conductivity cell by measuring the electrical resistance of a 1:2 soil water suspension and N for not suitable (Table 2).
| Parameter | S1 | S2 | N |
|---|---|---|---|
| Altitude (m) | 2000 | 2000–2500 | > 2500 |
| Slope (%) | 0–15 | 15–30 | > 35 |
| Rainfall (mm) | 600–1250 | 500–600 | > 1500 |
| 1250–1500 | < 500 | ||
| Temperature (°C) | 15–25 | 25–30 | > 30 |
| < 15 | |||
| Soil drainage | Well drained | Imperfectly drained | Poorly drained |
| Soil pH | 5.5–6.8 | 6.8–7.5 | > 7.5 |
| Soil texture | Loamy | Clayey | Very clayey |
| Extremely sandy | |||
| Soil EC (µS cm-1) | 0–800 µS/cm | 800–1000 | > 1000 |
Table 2: Capsicum land use requirements
The agro-climatic map was integrated with soil fertility map, crop nutrient data and biological data to produce a crop suitability map using Quantum Geographic Information System (QGIS) software. Suitability levels were based on FAO land suitability classification structure, which were ranked as S1 for highly suitable, S2 for moderately suitable, [15] S3 marginally suitable and N for not suitable (Table 2).
Data management and analysis
This Rainfall and temperature data obtained from the National Aeronautics and Space Administration (NASA) were entered into excel format file (NASA, 2020) [16]. Using MS excel, the data were cleaned to ensure that the values obtained are free from any obvious errors. The climate data was averaged for a given period and exported to QGIS software for further manipulation. Ordinary kriging, a geospatial method of interpolation was used to interpolate data points into a continuous surface. The final image produced was then clipped to the study areas by use of County boundaries.
Land use map for the three counties was produced using Landsat 8 satellite. The Landsat 8 image for each County was procured from the United States Geological Survey website. The image was corrected for errors such as those arising from radiometric and atmospheric effects. Digital image processing was done using Environment for Visualizing Images 5 software, to improve identification of features and exported to QGIS software for supervised classification for identification of various land uses. Topography data was also entered in MS excel then exported to QGIS software to be interpolated through ordinary kringing to have a representation of elevation values for every study area. The resultant was a continuous surface, which formed a raster image. This was then clipped to the areas of study using the County administrative boundaries. Slope data were derived using the toolbox properties of the QGIS software.
Soil pH was determined using a potentiometric method using a high impedance voltmeter on a soil suspension of 1:2 (soil: water) [8]. Electrical conductivity (EC) of the soil was determined using potentiometric method, made with a conductivity cell by measuring the electrical resistance of a 1:2 soil water suspension in an air-dried sample. Soil texture was determined by the hygrometer method while drainage was determined on the farmer fields following the percolation test. Soil analysis data (soil pH, EC, drainage, and texture) were exported to QGIS software where they were explored and displayed in a map format. Macro and micro nutrients in the soil were also exported to QGIS software for the production of soil fertility map.
Mapping of suitable locations for capsicumproduction
Climate, soil, topography, and landscape were used to determine the suitability of land for capsicum production. These characteristics were ranked differently and assigned a value between 0 and 100 (Table 3). These characteristics were then combined to give the optimal land use. Soil (pH, texture, EC, and drainage), climate (temperature and rainfall), landscape (land use) and topography (elevation and slope) data were used as the main criteria for land evaluation.
| Suitability index for a crop (average of a group of crops) | Degree of suitability | Symbol | Definition |
|---|---|---|---|
| 80–100 | Excellent | S1 | Highly suitable land with no limitations to the specified use |
| 60–80 | Moderate | S2 | Moderately suitable land with moderate limitations to the specified use |
| 40–60 | Marginal | S3 | Marginally suitable with severe limitation to the specified use |
| 20–40 | Currently unsuitable | N1 | Currently unsuitable land with severe limitations which cannot be corrected with existing knowledge and technology at currently acceptable cost |
| 0–20 | Permanently unsuitable | N2 | Permanently unsuitable land with severe limitations which cannot be corrected |
Standardization and reclassification of criteria
With the production of different thematic maps (Figure 2), relative importance of each criterion was required and was obtained by assigning weight to each criterion. For a reasonable comparison since the data used for the study were on different scales of measurements, a common standard was required to apply weighted overlay over each of the input criteria, this ensured that all factor maps produced correlated to the suitability.
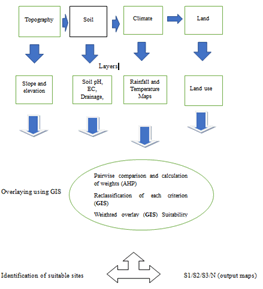
Figure 2:A methodology flowchart showing what data to be collected and its integration with GIS
This was achieved by use of spatial analysis tools [6]. The weight is a value assigned to an evaluation criterion indicative of its importance to other criteria under consideration with the larger weight being of more importance to the others. The selected criteria were subjected to processing, standardization, weighting and overlaying using QGIS software in the production of output maps. Each criterion was rated based on FAO (1985) classification as highly, moderately, marginally and not suitable [8]. Crop requirement characteristics were defined in relation to the listed criteria. Requirements were expressed by defining optimal, moderate, marginal, and unsuitable conditions for each land attribute that influence capsicum production.
Applying multi-criteria evaluation and assigning a weight of factors
The AHP method of MCE was used to assign weights to the different criteria. A pairwise comparison matrix was constructed for the criteria using information obtained from literature reviews. Each criterion was compared to other criteria relative to their importance on a scale of 1-9 [17] (Table 4).
| Intensity of importance | Definition | Explanation |
|---|---|---|
| 1 | Equal importance | Two factors contribute equally to the objective |
| 3 | Somewhat more important | Experience and judgment slightly favor one over the other |
| 5 | Much more important | Experience and judgment strongly favor one over the other |
| 7 | Very much more important | Experience and judgment very strongly favor one over the other |
| 9 | Absolutely more important | The evidence favoring one over the other is of the highest possible validity |
| 2, 4, 6 and 8 | Intermediate values | When compromise is needed |
Table 4: The Saaty’s rating scale
When a factor is compared by itself, it’s a signed a value of unity, whereas when compared to a different factor, it assumes any value within the Saaty’s range, the factor it compared with assumes the reciprocal value. The criteria weight and weighted sum value was calculated to get the approximate eigenvector (λmax), this was used in the calculation of consistency ratio (CR) (Eq. 1) [18].
CR=CI/RCI (Eq. 1)
Where CI=Consistency index and RCI=Random consistency index.
In AHP, the judgement matrix that is the pair wise comparison is only considered consistent if the CR is less than 0.01. The CI values were calculated using Eq. 2 [18].
CI=(λmax-n)/(n-1) (Eq. 2)
Overlaying map layers
To determine the potential of each peri-urban County of Nairobi for capsicum production, crop requirements were matched with land qualities; the reclassified thematic maps/layers of each variable such as soil, topography, agro-climatic map and land use map were weighted using the weights derived from the AHP process. The weighted maps/layers were overlayed by performing the weighted overlay analysis using spatial analyst tools (QGIS), after which a suitability map was prepared.
Results
Spatial variation of pH in Kiambu, Kajiado, and Machakos counties
The mean pH in Kiambu, Kajiado, and Machakos were 5.78, 7.71 and 7.02 respectively. After reclassification, the pH map shows that Kiambu County had the highest suitability at 99% while Kajiado had 20% of the area as not suitable, 70% moderate suitability and 9% being highly suitable. Additionally, 85% of Machakos County had moderate suitability with only 15% being highly suitable for capsicum production (Figure 3).
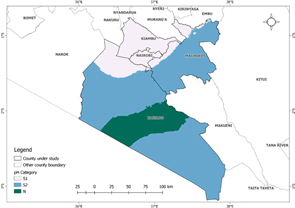
Figure 3:Spatial variation of soil pH in Kiambu, Kajiado, and Machakos counties.
Spatial variation of soil electrical conductivity in Kiambu, Kajiado, and Machakos counties
Soil EC is a measure of soil salinity. The reclassified EC map indicates that the counties had 98, 95 and 81% high suitability for Kiambu, Kajiado, and Machakos respectively (Figure 4).
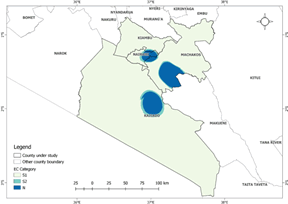
Figure 4:Spatial variation of soil EC in Kiambu, Kajiado, and Machakos counties.
Spatial variation of soil texture in Kiambu, Kajiado and Machakos counties
The relative proportion of sand, silt, and clay was combined to generate a texture class. Four textural classes were identified in the study areas namely clayey, loamy, sandy and very clayey. The reclassified texture map indicates that most of the counties have clayey soils with 81, 62 and 66% for Kiambu, Kajiado, and Machakos, respectively (Table 5) (Figures 5 and 6). Therefore, based on soil texture, the counties under study are moderately suitable for capsicum production.
| County | S1 Loamy (%) | S2 Clayey (%) | Sandy (%) | N Very Clayey (%) Very sandy (%) | Sum of Area (km2) |
|---|---|---|---|---|---|
| Kiambu | 1.42 | 81.04 | 0.57 | 16.96 | 1275.55 |
| Kajiado | 15.93 | 61.74 | 7.96 | 14.37 | 1874.02 |
| Machakos | 16.27 | 65.57 | 1.23 | 16.93 | 790.52 |
Table 5: Spatial variation of texture
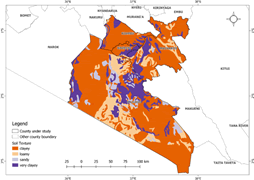
Figure 5:Spatial variation of soil texture in Kiambu, Kajiado, and Machakos counties.
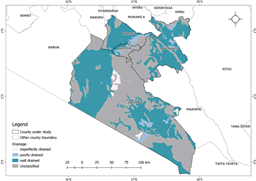
Figure 6:Spatial variation of soil drainage in Kiambu, Kajiado, and Machakos counties.
Spatial variation of soil drainage in Kiambu, Kajiado, and Machakos counties
Kiambu, Kajiado, and Machakos counties receive an average annual rainfall of 962, 500, and 830 mm, respectively. According to rainfall, the map shows that Kiambu County has 64% high suitability for capsicum production with the respective values for Machakos and Kajiado being 94 and 48% (Figure 7) (Table 6).
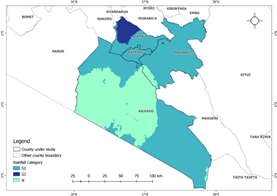
Figure 7: Spatial variation of rainfall in Kiambu, Kajiado, and Machakos counties
| County | S1 (%) | S2 (%) | N (%) | Total area (Km2) |
|---|---|---|---|---|
| Kiambu | 65.48 | 25 | 9.46 | 1275.55 |
| Kajiado | 46.42 | 49.61 | 2.04 | 1874.02 |
| Machakos | 52.96 | 43.04 | 4 | 790.52 |
| S1=highly suitable; S2=moderately suitable; N=Not suitable. |
Table 7: Land cover classes statistics of Kiambu, Kajiado, and Machakos counties
| County | Suitable (%) | Not suitable (%) | Total area (km2) |
|---|---|---|---|
| Kiambu | 50.15 | 49.85 | 1275.55 |
| Kajiado | 8.56 | 91.44 | 1874.02 |
| Machakos | 12.73 | 87.27 | 790.52 |
Table 8: Capsicum suitability area in percentage
Machakos counties
Spatial variation of temperature
The reclassified map shows that 99% of Kiambu County has temperatures of between 15°C and 25°C making it highly suitable for capsicum production (Figures 8 and 9). About 10% of Kajiado County has temperatures higher than 30°C, thus being unsuitable for capsicum production with 63% moderate suitability. Therefore, based on temperature, Machakos County had moderate suitability of 53% with only 42% being highly suitable.
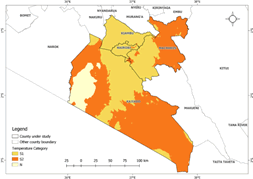
Figure 8:Spatial variation of temperature in Kiambu, Kajiado, and Machakos counties.

Figure 9:Spatial variation of altitude in Kiambu, Kajiado, and Machakos counties.
The Spatial variation of slope
The slope of the study areas ranged from 0° to 15°. It is within this range that capsicum production is highly suitable. Some areas in Kajiado and Machakos counties had slope ranges of 15°–30° (Figure 10).
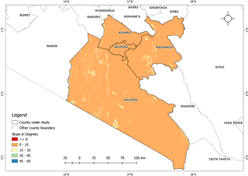
Figure 10:Spatial variation of slope in Kiambu, Kajiado, and Machakos counties.
Supervised classification results
The results from Landsat satellite imagery of the study areas indicates that land cover is majorly divided into six classes (crop land, forest, open grassland, wooded grassland, water/wetland, and built-up) (Table 7) (Figure 11). It further revealed that 50% of Kiambu is covered by cropland (agricultural land) while Kajiado and Machakos had 1 and 44%, respectively, in this category.
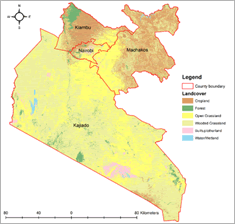
Figure 11:Land cover map of Kiambu, Kajiado, and Machakos counties.
capsicum suitability map
All the sub-criteria selected for evaluation (soil pH, EC, texture, and drainage, rainfall, temperature, slope, and altitude) using weighted overlay technique were overlaid together to produce capsicum suitability map (Table 8) (Figure 12). The results from the map show that about 50% of land in Kiambu County, 8% in Kajiado County, and 12% in Machakos are suitable for capsicum production. However, as the area of Kajiado County is much larger, in this county there is more suitable area for capsicum production than in the other counties. The remaining percentages were found not suitable for production of the crop.
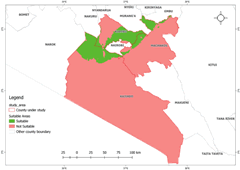
Figure 12:Capsicum suitability map for Kiambu, Kajiado, and Machakos counties.
Discussion
Suitable locations for capsicum production in the peri-urban counties of Nairobi
Suitable locations for capsicum production were obtained following analysis of the selected criteria for evaluation. The criteria included soil factors (pH, EC, texture, and drainage), climatic factors (rainfall and temperature) and topographic factors (altitude and slope). The same criteria were used by Kamau et al. (2015) in determining the suitability of growing potatoes in Nyandarua County. capsicum requires a soil pH range of 5.5–6.8 for optimal production [19].
Kiambu County had mean soil pH of 5.8 thus falling within the range that the crop thrives best. For this reason, Kiambu County had 99% suitability for soil pH. Kajiado and Machakos counties had mean soil pH of 7.71 and 7.02, respectively, and therefore not falling within the range required by the crop. Therefore, for soil pH, Kajiado and Machakos counties had 9% and 15% suitability, respectively. Soil pH provides an indication of the acidity and alkalinity status of the soils. It also determines the availability of nutrients in the soil for crops and subsequently provides information on the suitability for crops in different regions. To increase suitability levels, soil pH in Kajiado and Machakos needs to be addressed by lowering it to levels that is acceptable for capsicum. This can be achieved through addition of organic matter and elemental Sulphur.
Likewise, the salinity of the soils is indicated by soil EC and capsicum requires EC level less than 1000 μS cm-1 [4,5]. The mean salinity level in Kiambu, Kajiado, and Machakos counties was 96, 185, and 136 μS cm-1, respectively. Therefore, for soil EC, Kiambu had 98%, Kajiado 94% and Machakos 81% suitability meaning the salinity effects is negligible. A few locations mostly in Machakos County had EC values above 1000 μS cm-1 and therefore needs to be corrected to the acceptable crop level. This is particularly so since EC is a critical indicator of soil health and greatly impacts yield of crops, suitability of crops, nutrient availability and activity of soil microorganisms [12].
Furthermore, capsicum does best in loamy to sandy loamy soils [5]. Soil texture is important in determining suitability of the crop as it affects most properties of the physical of the soil [16]. There were five textural classes in the study area namely loamy, clayey, sandy and very clayey (more than 60% clay). Most soils in the study counties were sandy clay, silty clay and clay texture classes. This implies that based on soil texture, the counties had moderate suitability for capsicum production. It is difficult to alter the texture of the soil and thus the potential for these counties in the production of capsicum will be limited by their texture.
Soil drainage is an important indicator of water infiltration into the soil. Good drainage allows water and nutrients to move freely in the soil [11,16]. capsicum prefers well drained soils for optimal production. Based on soil drainage, Kiambu County has 65%, Kajiado 46%, and Machakos 53% suitability for capsicum production. Soil drainage is a soil physical property that is not easily altered but frequent use of organic manure can help improve some of its qualities [4,16].
Climate is critical in the production of capsicum. It requires an average temperature of 25°C to 30°C and 18°C to 20°C during the day and night, respectively [1]. Very high and very low temperatures have a great impact on setting of the fruits and their pungency. The mean temperature for the study areas ranged from 15 to 30°C. Kiambu County had the most favorable temperature for capsicum production with suitability of 99% followed by Machakos at 47% and Kajiado at 37%. The production potential of capsicum in Kajiado and Machakos County will be limited by the very high and very low temperatures in the different locations within the counties. Additionally, rainfall is the main source of water for irrigation and capsicum requires rainfall of between 600–1250 mm per annum for optimal production. The reclassified maps showed that Machakos County had the most suitability for capsicum production at 94% followed by Kiambu County at 64%, Machakos County and Kajiado 48% when based on rainfall alone.
Furthermore, topography of the study area was also evaluated. The slope of the study areas ranged between 0 and 15 ° while its altitude ranged from 0 to 2710 m. capsicum requires altitudes of up-to 2000 m above the sea level for optimal production. Based on topography alone, the study area was found to be highly suitable for optimal capsicum production.
The results from land suitability assessment for capsicum production categorized land as highly suitable and not suitable. Of all the three counties, Kiambu County had the most suitability i.e., 50% of the land (1225 km2) for the production of capsicum. Kajiado and Machakos had just about 8% (1703 km2) and 12% (714 km2) suitability, respectively. Land found not to be suitable is due to the prevailing limitations that exist in the counties. This includes unfavorable climate, soil pH, drainage, and texture. Nonetheless, the land classified as not suitable for capsicum production is used by farmers for the production of capsicum and other crops due to the high demand of food. Therefore, to improve the suitability and production of capsicum in Kiambu, Kajiado, and Machakos counties, it is advisable to consider decreasing soil pH particularly in Kajiado and Machakos, optimizing soil drainage through the use of organic manure/ compost and increasing soil nitrogen and organic carbon through addition of nitrogen fertilizer and organic manure respectively. In addition, farmers can consider use of irrigation to supplement rainfall and adoption of greenhouse farming to help in control of temperature. Kiambu County had the most suitability as its soil, climate, and topographic factors were found to be favorable for capsicum production.
Conclusion
Evaluation of land in the study area indicates that Kiambu County is more suitable for capsicum production. This County had 50% of the total land being suitable for the production of capsicum. In Kajiado and Machakos counties just between 8% and 12% of land was found to be suitable due to numerous factors that were found limiting production of the crop such as soil pH, drainage, texture, and climate. These limitations are the key drivers for the declining capsicum yields that have been observed over the years in these counties. The findings of this study would therefore be useful to farmers, County governments and stakeholders in their decision making and planning and to other researchers for further studies.
Acknowledgement
The authors hereby acknowledge Kenyatta University for technical support for this study and the National Council for Scientific and Technological Development (CNPq) of Brazil for providing an award for excellence in research to the eighth author.
REFERENCES
- Gitari HI, Gachene CKK, Karanja NN, Kamau S, Nyawade SO, Schulte-Geldermann E. Potato-legume intercropping on a sloping terrain and its effects on soil physico-chemical properties. Plant Soil. 2019; 438: 447–460.
- FAOSTAT- Food and Agriculture Organization Corporate Statistical Database (2019). Production of chillies and peppers (green) in Kenya.
- IIHR-Indian Institute of Horticultural Research (2019). Protected cultivation of capsicum-requirements for capsicum growth. Accessed on August 27, 2019
- USGS-United States Geological Survey (2020).
- CABI-Centre for Agriculture and Bioscience International (2019): capsicum ecological and nutrient requirements 2019; 30.
- Coertze AF, Kistner MH. The effect of plant population and mulching on green pepper (capsicum annuum) production under irrigation: Department of Soil, Crop and Climate Sciences University of the Free State Bloemfontein, South Africa.1994.
- FAO-Food Agricultural Organization (1976). Evaluate land suitability classification.
- Petja BM, Annegarn HJ, Newby TS. Using geospatial information technology for rural agricultural development planning in the nebo plateau, South Africa. J Agric Sci. 2004; 6(4): 1916–9760.
- Kuria D, Ngari D, Waithaka E. Using geographic information systems (GIS) to determine land suitability for rice crop growing in the Tana delta. J Geog Reg Plan.2011; 4(9): 525–532.
- Kihoro J, Bosco NJ, Murage H. Suitability analysis for rice growing sites using multi-criteria evaluation and GIS approach in great Mwea region, Kenya. SpringerPlus (2013) 2:265.
- USDA- United States Department of Agriculture (2020). Soil electrical conductivity-soil quality kit. Accessed on July 20, 2020.
- Triantaphyllou E, Mann SH. Using the analytic hierarchy process for decision making in engineering applications: Some challenges. Int J Ind Eng Appl Pract. 1995; 2 (1): 35–44.
- Kato Y. The expert system for selecting suitable crops using personal computer: Agri Info Res. 1993; 2(2): 75–88.
- Mugo JW, Kariuki PC, Musembi DK. Identification of suitable land for green gram production using GIS Based Analytical Hierarchy Process in Kitui County, Kenya. J Remote Sensing and GIS, 2016; 5: 170.
- Perveen MF, Nagasawa R, Ahmed AOC, Uddin MI, Kimura. Integrating biophysical and socioeconomic data using GIS for land evaluation of wheat cultivation: A case study in north-west Bangladesh. J Food Agric Environ. 2008; 6(2).
- Ryan J, George E, Rashid A. Soil and plant analysis laboratory manual, 2nd ed. Jointly published by the International Center for Agricultural Research in the Dry Areas (ICARDA) and the National Agricultural Research Centre (NARC). 2001; 46–48.
- Saaty TL. Decision making with the Analytic Hierarchy Process. Int J Services Sciences. 2008; 1 (1): 83–98.
- Stickler C, Coe M, Nepstad D, Fiske G, Lefebvre P (2007). Readiness for REDD: A preliminary global assessment of tropical forested land suitability for agriculture. United Nations Framework Convention on Climate Change (UNFCCC) Conference of the Parties (COP), Thirteenth session, December 3-14, 2007. Bali, Indonesia.
- Wanjiku M.K (2014). Food security research findings and recommendations-Kiambu County. African women’s Studies Center, University of Nairobi.
