Indexed In
- Genamics JournalSeek
- RefSeek
- Hamdard University
- EBSCO A-Z
- OCLC- WorldCat
- Publons
- Euro Pub
- Google Scholar
Useful Links
Share This Page
Journal Flyer
Open Access Journals
- Agri and Aquaculture
- Biochemistry
- Bioinformatics & Systems Biology
- Business & Management
- Chemistry
- Clinical Sciences
- Engineering
- Food & Nutrition
- General Science
- Genetics & Molecular Biology
- Immunology & Microbiology
- Medical Sciences
- Neuroscience & Psychology
- Nursing & Health Care
- Pharmaceutical Sciences
Research Article - (2020) Volume 9, Issue 4
An Artificial Swan Formation Using the Finsler Measure in the Dynamic Window Control
Jun S Huang1,2*, Siqing Ma1, Gao Li1, Oliver W Yang3 and Chang Shao12The Ottawa-Carleton Institute for Electrical and Computer Engineering, Carleton University, Ottawa, Canada
3The School of Electrical Engineering & Computer Science, University of Ottawa, Ottawa, Canada
Received: 24-Jun-2020 Published: 17-Jul-2020, DOI: 10.35248/2090-4908.20.9.186
Abstract
This paper studies the swarm formation control for a large number of unmanned robots (artificial swans) to expel invading objects (geese) in applications such as airport bird control. This control algorithm extends the existing DWA (Dynamic Window Algorithm) control by inserting a new term using the Finsler measure in the objective function during the optimization process. As demonstrated and proven with the simulation section and derivation in the appendix, the Finsler measure can gauge the degree of local collaboration among unmanned robots and therefore allow us to form a statistical collaboration strategy to control a swarm formation to expel invading objects. It also allows fast optimization and therefore real-time formation control of a large number of robots without seeing the robots to collide with each other or with obstacles along their moving path, because the new term in the objective function allows the trade-off between swan group moving speed and its group watch-out coverage. Our performance evaluation and analysis of different performance metrics via simulations demonstrate the feasibility of this control algorithm.
Keywords
Swarm intelligence; Swan algorithm; Window optimization; Finsler measure
Introduction
With the heavy development in the Artificial Intelligence area such as deep learning, Swarm Intelligence is also attracting more and more attention in the research community around the world [1]. In particular, there are various activities in autonomous vehicle applications ranging from daily transportation to the first responder [2]. Examples are airport bird watching [3] or search and rescue operations [4]. One interesting research area is to find a simple algorithm to control the movement of autonomous robots that can be automobiles, boats, airplanes and other moving platforms with a degree of intelligence in order to respond to command and changes in statistical sense [5].
The DWA (Dynamic Window Approach) is a collision avoidance strategy for mobile robots, and there are different algorithms. In the original algorithm developed by Fox, [6], their algorithm was designed for the dynamics of a wheel-based robot to move around while keeping a maximum clearance from any obstacles. It has two components: (1) a method to generate a valid search space of circular trajectories that are collision-free while reaching the destination safely within a short time interval; (2) an optimization process to obtain an optimal solution in the search space with an objective is to select a heading direction and a velocity for the robot to reach the target. The original DWA algorithm can provide a fast navigation for a robot in an unknown environment, but it lacks a guarantee to converge [7], and therefore reaching its goal correctly. Also its speed converging speed can increase dramatically in some cases [8].
There have been many improvements. An algorithm using motion planning [9] is proposed to decline the speed of a robot effectively before encountering an obstacle. Further improvement is made by using local information to provide a computationally efficient optimization. The resultant efficient DWA algorithm has been integrated into a popular ROS (Robot Operating System) package called the “local planner” since 2009 [10]. ROS is still used today in design of autonomous cars. However, the robot is known to get stuck in local minima easily. It has been proven that if the motion cost in the optimization is based on a navigation function, the DWA can provide convergence guarantees but at the expense of additional computation efforts. Later, Ogren and Leonard had proposed a modified algorithm [11] to guarantee convergence. The dual-mode MPC (Model Predictive Control) [12] construction was introduced for further enhancement and was proved mathematically to be stable [13]. MPC is used today in most autonomous buses. Seder and Petrovic had proposed a method [14] to combine global and local path planning in order to have a safer stratagem to achieve collision-free. This method turns out to be efficient but not for large outdoor area. Instead of using circle curves, [15] improved the original algorithm by applying clothoid curves to obtain a trajectory that is closer to the global path and the goal of motion planning. It is not just good for wheel-based robots, but also for airplane or ship motion planning. The traditional DWA algorithms are mainly designed for single robot applications, which do not be considered coordination among a swarm of robots. In order to have a more efficient path planning ability of swarm robotics, we present a new DWA algorithm in this paper.
Many robotic applications are using algorithms based on DWA nowadays, especially in the navigation and rescue areas. Initial applications are mainly found in robots doing individual jobs inside an office building [14]. A robot was used to explore a museum in order to conduct various excursions for visitors. Higher level applications can be found in synchro-drive robots that have integrated DWA algorithm to synchronize with each other to perform one task, For example, Brock and Khatib [15] had applied this synchro-drive approach to holonomic robots for local path planning. Unfortunately, it also needs lots of computations.
Robots working in groups have in fact found many interesting applications in recent years, e.g. autonomous underwater vehicles [16], but the number of vehicles involved is still small. One important aspect to form a large group (called swarm robots) is the development of collective decision strategies by assuming the actual motion planning has been done by low-level algorithms. The MIT and Harvard team has used very simple edge-following rules in making collective decision to attract one thousand robots (called Kilobots) towards some fixed-speed robots to form a specific shape [17]. Since the collective decision among the fixed-speed robots, called the swarm, does not have moving speed control, the swarm formation may take unpredictably long time to settle down to a desired shape.
A survey was done to cover almost every discrete and continuous consensus strategies for swarm robots, but it had no review of motion control of individual robots. Some artificial “potential methods” [18] can influence both the collective decision (such as the group moving direction) and the individual behavior (such as the moving speed). However, these methods would only exert the same “force” to every robot at the same location. In order for each robot to have its own “personality” (i.e., react differently to the same force/influence) one needs to design a push-and-pull potential function for each robot at each location, which is nearly impossible due to the huge number of combinations for a large number of robots under many different locations.
It is interesting at this point to make an observation and comparison with the world of nature. In the animal world, it is found that there are simple behavior rules that bound animal swarms (bird flock, fish school, or wild animal herd) into certain shapes. These natural behaviors appear to achieve dynamic optimizations under certain phenomena. For examples, swans are able to form a collaboration cluster (a sub-group usually in line-shape) to force/chase/expel a “geese” (a type of bird smaller than swan who cannot fight for the same food as swans,) to move in the direction they collectively wish. Since every goose may escape in a random pattern and speed, the swans have to adjust their shape dynamically in order to expel geese from their territory or their flight path. No single swan dominates. Every swan is making its contribution according to its own strength. This phenomenon of collaborated but distributed best-effort optimization according to different levels of contribution from each bird plays an essential role to achieve the final success [19].
The analogy can be found in unmanned vehicle (robots) moving on the ground, running underground, swimming in the sea, or flying in the sky. Whatever the situation, their underlying formation has to share some common control strategy [20] especially when a swarm becomes large. Furthermore, without dynamic and local optimization the swarm shape could be very slow to form, as seen in the Kilobots project [21] which took 12 hours to just form a simple wrench shape. As such, we shall take another approach here: instead of setting up rules, we simply change the observation measurement, like using the fish eye to perceive threats from the distance, either shore or air.
The Finsler measure [22] used in our optimization has an origin from the mass-luminosity relationship for stars larger than our sun, where space time are distorted like fish eye view. It is also related to the congruence number [23], defined as arithmetic square number, that is the rational or equivalently the integer number falling on diagonal saddle line. This also explains how distance is actually observed/distorted in different way under different situations. As far as these authors are aware, Finsler measure is the first time used in robotic swarm formation.
The general problem we are trying to solve is how to form a self- organized pattern/formation for a swarm (a large number) of moving platforms around a given number of moving targets in the presence of some relatively slow moving [24] or fixed obstacles. Specifically, we are interested in a distributed algorithm for a swarm of moving robots to form a given shape in order to expel some live targets within a territory, with the possibility of obstacles along their moving path.
Although there are many algorithms and applications of the DWA, there does not appear any work that specifically address our swarm formation needs such as [7,14] therefore, we shall propose a variation of the original DWA to overcome some of their disadvantages such as the converging speed reviewed above. We shall combine the collective decision-making with the motion control so that the swarm cluster can be achieved in a shorter time. We shall design a swarm controller using the idea of geese for neighbor collaboration within a local cluster. We shall use the Finsler measure formula to measure the level of collaboration within a coverage territory so that the best path can be chosen in real-time, but without the complexity (of having to examine all paths in order to select the best) found in other algorithms. To demonstrate the validity of our algorithm using the Finsler measure for distance, we have conducted large scale simulations of using artificial swans to expel geese. We shall use the original Player/Stage simulator [25] because most of the robot simulators (including the ROS-based simulators) [11] cannot simulate a large number of robots.
The contributions of our paper are the following:
1. Formulating a variation of existing DWA algorithm that can support a large robot statistical formation in real-time.
2. Using the Finsler measure in the optimization process. As far as these authors are aware, this measure is the first time used in robotic formation. We also use a number of theorems to prove the Finsler measure is better than the Euclidean measure which allows us to eliminate the complicated push-and-pull functions used in the traditional formation control algorithms.
3. Using simulations to demonstrate the validity and efficiency of our algorithm for the statistical control of the swarm.
The paper is organized as follows: next section describes the modified dynamic window approach control with details in the optimization process. An example section is given, followed by proof section proves that Finsler measure is a better measure and how it is used in the collaboration of swarm. Simulation section provides performance evaluation results of our algorithm on the given example to demonstrate the efficiency of our algorithm. Conclusion is offered in last section with potential extensions for future research. The Appendix provides details of proofs on the Finsler measure.
The Modified Dynamic Window Control
We have extended the original Dynamic Window Approach [7] by modifying the objective function. The introduction of the 4th term using the Finsler measure allows us to capture the collaborations among individuals while minimizing the computational complexity to achieve a formation shape in a robot swarm. We shall first describe the components of our modified DWA algorithm. We shall focus on the local swarm collaboration mechanism first by assuming knowledge of the moving pattern of a target. Then we discuss the objective function that can facilitate a fast optimization using the Finsler measure. An example is provided at the end to elucidate all operations as well as the terminologies.
Distributed Algorithm
The distributed algorithm executed by each autonomous robot has the following steps as evolved over time (identified by steps n).
At time step n=0
1. Start with a pre-defined direction d, translational speed v, and angular velocity w. Also the safety distance (from neighboring robot) and the number of paths p in the window to be optimized.
2. Determine the distance and direction of the moving robot and target to be expelled.
3. Determine the distance and direction of all neighboring moving robots
4. Determine the Finsler measure (as formulated in Section Finsler measure)
5. Determine the deviation of present robot from the planned direction, the clearance from the closest obstacle that intersects with the path curvature and the speed to arrive at the next desired position on the current trajectory.
6. For count=1 to p Evaluate each path with the objective function G(v,w) as given in equation (1) below.
7. Determine the optimum path which has highest G(v,w) and move the moving robot to the new location according to d, v,w and the duration of each time step,
8. If a neighbor is within the crashing distance choose its next best set to compute the distance until no crashing is found.
9. Repeat steps 2 to 8, until target is outside coverage area.
The steps above depict how to move each robot towards its goal area occupied by a target, without crashing into its neighbors or obstacle, until it moves out of the goal area. The end result is usually random, depending on which robot bumping into which target first, but should not matter as long as the targets are expelled out of the desired restricted region statistically.
During the operation, we use the traditional dynamic window approach. We also introduce the concept of diagonal saddle orientation and maximum coverage area (to extend the group watch-out field-view) setting among the robots. As robots are getting too close or too far from each other, the coverage area becomes smaller or larger. And the Finsler measure will be smaller (systolic pull effect) or larger (diastolic push effect) than that measured by the Euclidean counterpart. A candidate solution occurs when the robots are apart at the ideal/optimum distance and orientation;
The swarm coverage area will be the maximum while the Finsler measure will be minimum. By this way, we are able to coordinate a large number of robots instead of the traditional artificial push-and- pull potential functions used in deterministic control algorithms that have a complexity problem of having to examine case by case of different scenarios before choosing an optimal solution.
The following assumptions pertain to our operations
1. The entire population consist one type of members with the same computation power and the same sensory range. This allows the simplification of the self-organization design.
2. Each robot is able to see its neighborhood and target(s). This would allow the measurement of the distance to the neighborhood objects.
3. The moving pattern of a target is known to allow us to evaluate the capability of our algorithm.
Optimization strategies
The objective function of our DWA algorithm is as follows.

It is an extension of the objective function in the original DWA [7] by introducing a 4th term called area(v,w) as a function of the angular velocity w and translational velocity v of the robot. The objective function G(v,w) is the evaluation score of a possible path (v,w) to a given position desired by the robot in the next time point n. As v and w are different at different locationseach robot uses its own objective function and its score to optimize it local trajectories.
The four component functions in the objective function are as follows:
1. The function “heading” measures the deviation of the robot from the planned direction. It is given by 180-theta, where theta is the angle of the predicted position in the next time point relative to the current heading of the robot. The higher the function value, the higher the deviation (and therefore less desirable)
2. The function “dist” measures the clearance from the closest obstacle that intersects with the path curvature. It is preferred to have a high function value. If no obstacle is on the curvature this value is set to ten times of the safe distance in this study. A small multiple times can be set if the swarm size is not too large.
3. The function “velocity” evaluates the speed to arrive at the next desired position on the current trajectory. We simply use a linear moving speed while ignoring the turning speed since the interval between two time points is very small. The higher value indicates a higher order curve integration calculation will be involved instead of linear integration used here.
4. The function “area” is the Finsler measure indicating the “inequality level” among the neighboring robots around you. It is an average in terms of their neighboring distance and orientation. It has a minimum value of 0 if all neighbor is uniformly distributed around you while moving towards (or away from) you, and is independent of the swarm size. A maximum value of 1 is reached when each neighbor is after a different target with diversified positions in the space. To avoid the complicated complex number evaluation, only the amplitude of the diversity distance is calculated and the directional information is omitted. The measure becomes a real number. Therefore, the measure reflects the level of “courtesy collaboration” among neighboring cluster of robots and the capability of a swarm to expel targets under a concerted effort.
All four components of the objective function are normalized to (0 1) with respect to summation of all terms in order to remove the magnitude effect of each function value. Each function is weighted by a factor such as α and β to emphasize its importance in the Objective Function. It turns out these weights play an important role in turns of balance of the control of the above mentioned four features, which is the subject of investigation in our performance evaluation later.
As v and w are continuous variables in performance evaluation, obtaining an optimization is simple by taking the double derivatives over v and w and setting them to zero, from which the (v,w) to give an optimization can be determined.
By converting a complicated collective decision and motion planning problem into a pure simple mathematical optimization, a robot only need to find the path that delivers the largest G(v,w) score from among all paths (v,w) available during a planning cycle. For example, if the human driver brain can analyze paths at a rate of 10 Hz (i.e. 10 paths per second), and by considering a cycle length of 1 second, one only needs to evaluate a maximum of 10 possible paths that the robot can deliver under different driving constraints (such as steering, gas consumption, braking distance). These 10 paths set would form a dynamic/controllable window for path adjustments. Obviously, the set size in the same controllable window can be much larger for faster robots when using computer power.
This computation allow a regular robot to reach its destination with the best orientation, the best safety collision distance, at the fastest speed and with the most uniform distribution coordinated with the neighborhood robots; all are achieved simultaneously.
Application Example
A practical example is provided here to provide more meaning and definitions to the wording used throughout this paper. This example is used in our simulation study section below.
The example comes from the common headache faced by every airport in having to expel birds away from the flight path area (both landing and taking off).So man-made flying swans mimicking the behavior of their natural competitors (e.g. geese) can be used to scare them off. These flying swans would use the modified DWA to form a shape formation to expel the birds.
With reference to the modified DWA above, the geese in the simulation are the target robots to be expelled by artificial swans (autonomous robots) while the green reference robots in simulation section represent the slow moving obstacles. From their initial positions (with initial values of v,w,d… determined/known), we would like to investigate the success of our algorithm by observing how the artificial swans expel the geese over increasing time steps n as they move along a path with some obstacles in the way.
Finally, our example can extend easily into other machines with artificial intelligence which can be vehicles, unmanned planes or boats.
Finsler measure
Previous section has shown the importance of the Finsler Measure to reflect the capability of a swarm to expel targets using a concerted effort. It is effectively a normalized area measurement. In this section, we shall provide more on the mathematical features and rationale of using this special area measurement to reflect the level of “courtesy collaboration” among neighboring cluster of robot. We shall review/summarize some definitions first, followed by a series of theorem and discuss why the Finsler measure is a better measure used in the collaboration of swarm. Some proofs of its validity are provided in the Appendix.
The length of a vector V=(x1, x2,….., xn) in an n-dimensional real vector space Rn is usually given by the Euclidean norm. The Euclidean distance between two points A and B can be captured by the vector AB whose length represents the straight-line traveling distance between A and B in a L2 norm space, see below formula (2) for p=2. However, there are other applications and scenarios where the Euclidean distance is insufficient to measure the actual traveling distances. The scenarios can be represented by the generalized Lp-norm space whose distance is given by

Where, p is a positive rational number, The L∞-norm space or maximum norm (or uniform norm) space is the limit of p → ∞. It turns out that this limit is equivalent to the definition of maximum operation. On the other hand, in the L1-norm space its distance is the rectilinear distance to the destination. An example is the distance traveled by a taxi driver in grid-pattern streets (such as downtown Manhattan) that are either orthogonal or parallel to each other (i.e., p=1).
It turns out the p-norm may not be good/general enough to cover all “distance” perceived under different physical environments. Examples are the deformation the space time under heavy gravitation force. Hence a f-norm is defined whose distance is a function of the Euclidean distance and which can account for nonlinear systolic pull and diastolic push effect distance.
Consider swans looking for tiny food high up from sky and when flying in a flock (swarm formation). Since the earth is no longer flat from up there, the Finsler measure turns out to be a proper/better indication of distances that are distorted in different ways from different observations from the eyes of a bird.
Let x and y be Euclidean distance between two swans on the x-axis and y-axis respectively. Then the front view distance DS of a far object perceived by a swan is a Finsler distance given by

It is the hypotenuse of flying triangulation formalization. The side-view distance DB from a swan’s eye on a nearby object moving/ flying in a diagonal saddle is given by

It is one of right angle edge. Then the distance between two flying swans is given by the variable

It is the other right angle edge. The coverage area-based DF estimated from the eye of a swan within a cluster is given by

Where sum is the function summing up the distances/areas all nearby neighbor cluster as seen through the eye of a swan.
Compared to the Euclidean Distance this distance measure can be used by a swan to avoid collision, as DS exaggerates the distance and DB maximizes the saddle clearance. The parameter AV is used to indicate systolic pull and diastolic push effect for adjusting the area coverage, when the actual distance is too close or too far away, while DF provides the balance within the cluster.
Note that if we replace the Finsler area by the Euclidean distance and change the coefficients slightly, formula (5) is similar to the Matyas function which is a test function commonly used in the optimization community. The Matyas function has a nice feature of having no local minima except the global one. This allows us to fulfill collaboration with a simple formula, by using the Finsler area in (6) to find the global minimum.
Formula (5) can also be used by autonomous cars to measure distance because these cars mainly use LIDAR (Laser Imaging, Detection And Ranging) or RADAR (Radio Detection And Ranging) to detect the distances to surrounding objects, including neighboring robots, targets to expel and obstacles to go around. These machines use normal Euclidean measurement to provide the input x and y for the formula (3) to (6).
Theorems and Proofs
We shall summarize all the proofs to show the Finsler measure satisfies the definition of the norm and that it can provide the minimum on the said distance and orientation. For clarity, we leave the proofs in the Appendix.
Theorem I shows the existence of such metric. Theorem II uses to prove the Finsler measure is better than the same measure without congruence information.
Theorem I: Non-quadratic congruence information metric
On a finite Finsler manifold, there exist an aggregated measure f-norm called sum(AV), where AV(Area Variable) is a positive real number derived from a pair of neighbor points coordinate:

AV is a Finsler metric, a non-quadratic metric that is neither Euclid nor Riemann.
Proof: Please see Appendix for details.
The input into above formula comes from the laser sensor that measures the distance, which naturally comes with errors, the error becomes the perturbation to the outcomes, and as such we need to further do following simplified perturbation analysis.
Theorem II: Error information metric perturbation
On a finite Finsler manifold, there exist an aggregated measure called sum(AE), AE stands for Area Euclidean, a positive real number that is given by a pair of neighbor points coordinate:

where AE is of Euclidean metric, it is a quadratic metric, and we have

As long as the perturbation is proportional in any directions
Proof: Please see Appendix for details.
Above theorem only said the error bound, but doesn’t know exact how big the error is, in the future work, we will tell exact value, with extra assumption, that is realistic in real life situation.
Results and Discussion
We use the well-known Player/Stage simulator [25] to carry out the evaluation of our algorithm to accomplish a flight formation. We want to show our simple area-based collaboration algorithm is capable to achieve a swarm formation as if there is a potential field with a short convergence time. Also it is capable to form diagonal saddle cluster, and use it to expel invaders. All distances are calculated by the iterative formula called “swan swarm algorithm” of which the complete code can be found on github under the contribution title “swan swarm algorithm”. Each individual is equipped with a LIDAR with a range of 10 m to detect robots, birds or obstacles nearby. There are 420 swans. Simulations are conducted on an Intel i7 Laptop and using the LINUX platform simulated for 100 seconds with a large flock, and a typical computer run time for each simulation is about 5 hours. Each simulation has been repeated 10 times, each using a different simulation seeds, α=0.05,β=0.2,γ=0.1 are fixed as original DWA recommended. Since the results/observations are similar, we present one set of time-evolution plots only.
There are 420 individuals, of which 21 are green reference robots that run on a fixed horizontal route by themselves without any optimization nor any interactions with others. They are used as references of moving speed in the simulation or obstacles to other fast runners. Of the remaining 399 individuals, 104 are blue geese to be expelled by 274 red artificial swans. In order to allow easy visual tracking of the many artificial swans (295 of them), we make the 21 of them cyan artificial swans to stand right beside the reference obstacles. There are also 8 orange fixed obstacles distributed in a V shape (but rotated 90 counterclockwise) on the right in order to disrupt the flight paths of all individuals.
The initial positions of all these individuals and obstacles are depicted in (Figure 1), with the 21 cyan swans standing right beside the reference robots. The square box represents an area of 150 m by 150 m in the corner of an airport from which the blue birds must be expelled by the 274 red and 21 cyan swans using line-shaped cluster formation. All individuals start moving from the left to right (towards the home of the geese) at a speed of 5 to 25 m/s. The varying speeds are due to swarm interaction induced through the random noise sensors. Except for the non-collaborating reference robots, all other individuals can collaborate with its neighbor as much as they can by running the swarm collaboration formula described before.
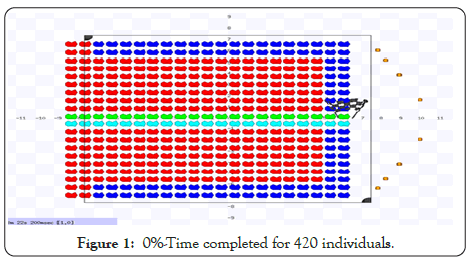
Figure 1: 0%-Time completed for 420 individuals.
Figure 2 shows the positions of the individuals at 20% time into the simulation run. We can see the green reference robots are running much slower than others. Their speeds are fixed and non- optimized (because their optimization is turned off to acting as additional moving obstacles). The rest of the robots spread out quickly according to the dynamic window control optimization. One can see that most cyan swans are less active than the red swans because they are farther away from blue birds, and thus there is less movement or displacement away from its original position through the interactions.
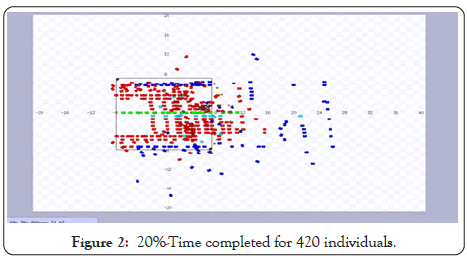
Figure 2: 20%-Time completed for 420 individuals.
Figure 3 is 40% time into the simulation run. We can see almost all cyan and red swans are actively expelling the blue birds which are within their sighting range now.
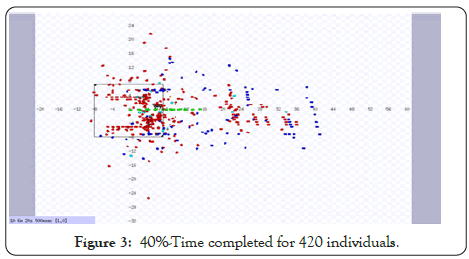
Figure 3: 40%-Time completed for 420 individuals.
From Figures 4 and 5, one can see that 90% of blue birds have been expelled successfully from the restricted square area at 60% time and increases to 95% at 80% time into the simulation run.

Figure 4: 60%-Time completed for 420 individuals.

Figure 5: 80%-Time completed for 420 individuals.
Figure 6 is the completion of the simulation run. We can see two third of the square is free of blue birds. That is good enough for expelling birds from an airport bird in real-life. This task we wanted to escort the blue bird all the way to the designated goal area far from the airport, we will not call back the swans halfway through.
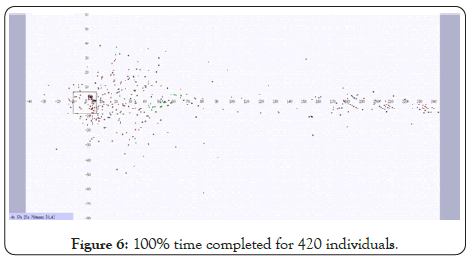
Figure 6: 100% time completed for 420 individuals.
Conclusion
We have proposed a new DWA for autonomous robots to expel invading objects. This is a modification of existing algorithm by carefully implementing a new objective function in the optimization process. Our performance evaluation and analysis via simulations section demonstrate the feasibility of this algorithm. It allows a very large team of autonomous robots to be controlled real-time without collision and can have many potential applications such as airport bird control.
For the first time, the Finsler measure is used in the robotic formation and optimization processes. It allows us to eliminate the complicated push-and-pull functions. This work is expelling the invader birds out of a given territory in a linear direction. It can be extended to the scenario that the swan can be divided into the task teams, some team matches with escorting out of airport geese, the other team may return back to airport matches with remaining geese that are reluctant to leave.
The effect of the laser sensor noise on the swarm area formation error is calculated and proven. With the proven theorem, the Finsler methodology is ready to be extended to variations of dynamic window approach or other statistical robot planning method, as long as the planning method making use of the optimization approach, where an object function exists.
Our future work may include the following:
1. Investigate the effect of low-level motion planning,
2. Forming different shapes to expel invading geese,
3. Possibility of partial returning of the artificial swans,
4. Expelling multiple-homed geese,
5. Investigate the effects of other weight values of α, β, γ.
Appendix: Proofs of F-Norm Theorems
In a short summary, Finsler measure is usually used to depict a non-quadratic metric while the Euclidean measure is a used for a quadratic metric. We have used a number of theorems to prove the Finsler measure is better than the Euclidean measure. The proofs of the Theorems are derived based on the definition of the Finsler measure and the congruence number.
Proof of Theorem I: Existence of a non-quadratic congruence information metric
On a finite Finsler real manifold, there exist an aggregated measure f-norm called sum(AV), AV stands for Area Variable, a positive real number that is given by a pair of neighbor points coordinate:

Where AV is of Finsler metric, that is neither Euclid nor Riemann, it is a non-quadratic metric.
Proof:
Let AV denote the area defined on Finsler Geometry, it is easy to prove that if AV is of f-norm then sum(AV) will be also of f-norm. It is also not hard to see that AV satisfying the first two properties of the measure f-norm, i.e.(1) when x=y=0, we have AV=0. (2) Swapping x and y does not change the value
We shall focus on the third property, which is the sub-additive rule. To do this, first let x1, y1 and x2, y2 be the points on the manifold, then we need to proof that we have

Assume that x1, y1 and y2, y2 will be the two points of the right- angled triangle, we can show that
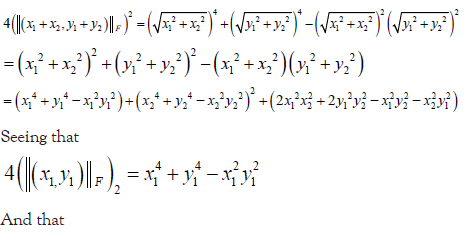
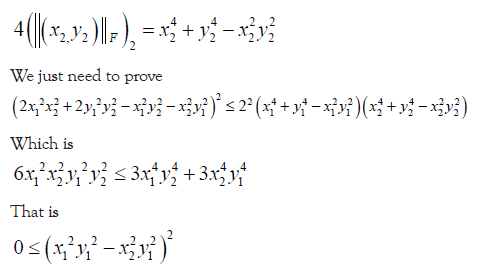
It is obviously true for any real value of points on manifold, this ends the proof.
Proof of Theorem II: Existence of an error information metric perturbation
On a finite Finsler real manifold, there exist an aggregated measure called sum(AE), AE stands for Area Euclidean, a positive real number that is given by a pair of neighbor points coordinate:

Where AE is of Euclidean metric, it is a quadratic metric, and we have

As long as the perturbation is proportional
Proof:
From Lemma II, substitute and
Then we have
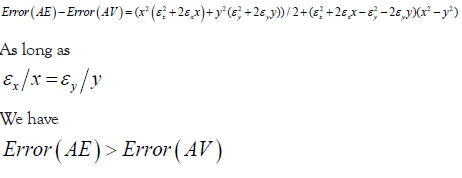
This ends the proof.
Acknowledgement
Thanks go to Ce Ma, Dabu Zhang, Lijun Sun, Qiqi Duan, Yijun Yang for discussions of the algorithm. And thanks go to Prof. Yuhui Shi for financially supporting the research activities.
REFERENCES
- Fernando M, Liu L. Formation control and navigation of a quadrotor swarm. in: 2019 International Conference on Unmanned Aircraft Systems (ICUAS) 2019; 284-291.
- Celi F, Wang L, Pallottino L, Egerstedt M. Deconfliction of motion paths with traffic inspired rules. IEEE Robotics and Automation Letters. 2019; 4: 2227-2234.
- Kim CH, Jeung KM, Choi YS, Lee SU, Kim CH, Jeong TW. Design of the unmanned ground vehicle for bird expellant in an airport. In: 2011 11th International Conference on Control, Automation and Systems 2011; 1094-1097.
- Lomonaco V, Trotta A, Ziosi M, Avila JD, Díaz-Rodríguez N. Intelligent drone swarm for search and rescue operations at sea. arXiv preprint arXiv: 1811.05291. 2018.
- Missura M, Bennewitz M. Predictive collision avoidance for the dynamic window approach. in: 2019 International Conference on Robotics and Automation (ICRA) 2019; 8620-8626.
- Fox D, Burgard W, Thrun S. The dynamic window approach to collision avoidance. IEEE Robotics & Automation Magazine. 1997; 4(1): 23-33.
- Ogren P, Leonard NE. A convergent dynamic window approach to obstacle avoidance. IEEE Transactions on Robotics. 2005; 21(2): 188- 195.
- Schröter C, Höchemer M, Groß HM. A particle filter for the dynamic window approach to mobile robot control. InProceedings of the 25nd International Scientific Colloquium (IWK), Ilmenau 2007; 425-430.
- Brock O, Khatib O. High-speed navigation using the global dynamic window approach. In: Proceedings 1999 ieee international conference on robotics and automation (Cat. No. 99CH36288C) 1999;1: 341- 346.
- Stachniss C, Burgard W. An integrated approach to goal-directed obstacle avoidance under dynamic constraints for dynamic environments. In: IEEE/RSJ international conference on intelligent robots and systems 2002; 1: 508-513.
- Quigley M, Conley K, Gerkey B, Faust J, Foote T, Leibs J et al. An open-source Robot Operating System. InICRA workshop on open source software 2009; 3(2): 5.
- Mayne DQ, Rawlings JB, Rao CV, Scokaert PO. Constrained model predictive control: Stability and optimality. Automatica. 2000; 36(6): 789-814.
- Primbs JA, Nevisti( V, Doyle JC. Nonlinear optimal control: A control Lyapunov function and receding horizon perspective. Asian J Control. 1999;1(1): 14-24.
- Seder M, Petrovic I. Dynamic window based approach to mobile robot motion control in the presence of moving obstacles. InProceedings 2007 IEEE International Conference on Robotics and Automation 2007; 1986-1991.
- Brock O, Khatib O. High-speed navigation using the global dynamic window approach. In: Proceedings 1999 IEEE international conference on robotics and automation (Cat. No. 99CH36288C) 1999; 1: 341-346.
- Tusseyeva I, Kim SG, Kim YG. 3D global dynamic window approach for navigation of autonomous underwater vehicles. Int J Fuz Log Intel Sys. 2013;13(2): 91-99.
- Rubenstein M, Cornejo A, Nagpal R. Programmable self-assembly in a thousand-robot swarm. Science. 2014; 345(6198): 795-799.
- Wang H, Zhao LY, Chen W. A mobile robot obstacle avoidance method based on improved potential field method. In: Applied Mechanics and Materials 2014; 467: 496-501.
- Azam MA, Ragi S. Decentralized formation shape control of UAV swarm using dynamic programming. In: Signal Processing, Sensor/ Information Fusion, and Target Recognition 2020; 11423: 114230I.
- Valentini G, Ferrante E, Dorigo M. The best-of-n problem in robot swarms: Formalization, state of the art, and novel perspectives. Frontiers in Robotics and AI. 2017; 4: 9.
- Asanov GS. Finsler geometry, relativity and gauge theories. Springer Science & Business Media; 2012; 6.
- Arnold V.I. Catastrophe Theory, Springer-Verlag, Berlin, 1986.
- Stein W. Elementary number theory: Primes, congruences, and secrets: A computational approach. Springer Science & Business Media; 2008.
- Shirazi AR, Jin Y. Regulated morphogen gradients for target surrounding and adaptive shape formation. IEEE Transactions on Cognitive and Developmental Systems. 2020.
- Gerkey B, Vaughan RT, Howard A. The player/stage project: Tools for multi-robot and distributed sensor systems. In: Proceedings of the 11th International Conference on Advanced Robotics. 2003; 1: 317- 323.
Citation: Huang JS, Ma S, Li G, Yang OW, Shao C (2020) An Artificial Swan Formation Using the Finsler Measure in the Dynamic Window Control. Int J Swarm Evol Comput. 9:186. DOI: 10.35248/2090-4908.20.9.186
Copyright: © 2020 Huang JS, et al. This is an open-access article distributed under the terms of the Creative Commons Attribution License, which permits unrestricted use, distribution, and reproduction in any medium, provided the original author and source are credited.
