Indexed In
- Open J Gate
- Genamics JournalSeek
- JournalTOCs
- China National Knowledge Infrastructure (CNKI)
- Electronic Journals Library
- RefSeek
- Hamdard University
- EBSCO A-Z
- OCLC- WorldCat
- SWB online catalog
- Virtual Library of Biology (vifabio)
- Publons
- MIAR
- Euro Pub
- Google Scholar
Useful Links
Share This Page
Journal Flyer
Open Access Journals
- Agri and Aquaculture
- Biochemistry
- Bioinformatics & Systems Biology
- Business & Management
- Chemistry
- Clinical Sciences
- Engineering
- Food & Nutrition
- General Science
- Genetics & Molecular Biology
- Immunology & Microbiology
- Medical Sciences
- Neuroscience & Psychology
- Nursing & Health Care
- Pharmaceutical Sciences
Research Article - (2024) Volume 15, Issue 3
Adsorptive Removal of Heavy Metals from Oil Well Produced Water Using Citrus sinensis Peel
Stephen G Udeagbara1*, Isehunwa S.O1, Okereke N. U2, Nwanwe O2, Oguama I2 and Kerunwa A22Department of Petroleum Engineering, Federal University of Technology, Owerri, Nigeria
Received: 07-Mar-2022, Manuscript No. JPEB-23-19492; Editor assigned: 10-Mar-2022, Pre QC No. JPEB-23-19492 (PQ); Reviewed: 24-Mar-2022, QC No. JPEB-23-19492; Revised: 15-Jul-2024, Manuscript No. JPEB-23-19492 (R); Published: 12-Aug-2024, DOI: 10.35248/2157-7463.24.15.575
Abstract
Produced Water (PW) from hydrocarbon reservoirs contains toxic metals very often and other impurities that are harmful to the ecosystem This research was aimed to checkmate the impact of citrus sinensis (orange peel mixed with the fiber) as a bio-adsorbent for the treatment of PW from Niger Delta oil field.
An adsorption column of 2.0 m (0.4 m internal diameter) with four treatment compartments was fabricated using standard procedures. Citrus sinensis peel was washed thoroughly with distilled water, sun-dried (4 days during harmattan period) and oven-dried at 105 ± 5°C for 3 hours. It was ground into powder, sieved (150 and 300 microns) and then washed with 0.4 mol/L HNO3, filtered and rinsed with distilled water to remove any impurity that might interfere with the result. Sample of PW was obtained from field R in the Niger Delta and analysed for heavy metals using an Atomic Absorption Spectrophotometer (AAS). Sample was treated in adsorption column over 3 hours using 150 micron size of adsorbent. Treatment was repeated with 300 micron size. Adsorptions of heavy metals were evaluated after treatment using Langmuir and Freundlich models. Data were analysed using regression and ANOVA at α 0.05.
Concentrations of barium, copper, lead (96.2), nickel (47.2) and cadmium (78.6) in PW from field R reduced by 42.1, 96.1, 96.2, 47.2 and 78.6 percent, respectively after 4 hours of treatment with 150 micron size and for 300 micron size, the concentrations of the same metals reduced by 3.0, 88.8, 57.1, 11.8 and 18.4 percent respectively. The concentrations of other metals were equally reduced to an acceptable limit. The orange peel (Citrus sinensis peel) bio-adsorbent was effective in the adsorption of the metals present in the PW. Langmuir model best described the adsorption of lead with isotherm R2 of 0.97, while Freundlich isotherm described the adsorption of nickel and iron, with isotherms R2 of 0.84 and 0.93 respectively.
Produced water from Niger Delta oil field was effectively treated of contaminants using Citrus sinensis peel with 150 micron size gave the best result.
Keywords
Oil field water treatment; Heavy metals adsorption; Adsorption isotherms; Bio-adsorbents
Introduction
Water is important for drilling, well stimulation and for tertiary recovery purposes. Water needed for these operations can come from groundwater or surface sources as well as from municipal water supplies or at times water recycled or re-used from some other source. Some of the water sent to the subsurface for drilling and other well completion activities comes back to the surface and should be treated as a waste stream. The waste stream also involves water emanating from subsurface geologic formations as a result of drilling, stimulating as well as completion activities.
Produced water is a disposable stream that returns to the surface from the subsurface during production of oil or gas, and comprises formation water and water injected into the formation during well stimulation process or during enhanced oil recovery processes. Produced water is usually generated throughout the life of a well. Based on studies, about 21 billion barrels of produced water is generated annually in the United States. Another important produced water category is called flow back water generated when some of the water flows back after water injected at high pressure into a formation during a well stimulation process like hydraulic fracturing is completed. Produced water generated by flow back water usually contains chemical constituents and dissolved salts, which are more than the original fracturing fluid.
Produced water could as well be referred to as a waste stream emanating from the reservoir during the process of production of oil and gas from the reservoir. Water is typically discovered alongside oil and gas within the subsurface reservoir, with water found to settle beneath the other components within the reservoir because of its higher density. This naturally occurring water in the reservoir is referred to as formation water or connate water. Water production can occur during oil and gas well operations after production has taken place for a long time, depending on the reservoir drive mechanism controlling the well. Production of reservoir fluids (oil and gas) from the reservoirs is always accompanied by water (brine). This water produced alongside the oil is called ‘produced water’. Volume of oil and gas produces decreases, while that for produced water increases with time such that it exceeds the oil volume and gas extracted before the reservoir goes below economic limit [1]. The profitability of oil and gas field development is negatively affected by excess water production because more cost is incurred in managing the produced water which is in excess of oil and gas production volumes. These produced waters have many constituents, with negative impacts on the environment. Among the constituents are heavy metals. Other produced water treatment methods associated with polymer flooding were highlighted in the research works.
The physiochemical properties of produced water vary based on the location and the geology of the field, the characteristics of the geologic formation from which the water was extracted and the nature of the produced hydrocarbon from the field. For fields where water injection is carried out, the properties and volumes of the extracted water may vary due to the introduction of additional water into the well to enhance hydrocarbon extraction. Presented the main constituents of produced water and will be the focus of this work.
• Salt content of water which include salinity, conductivity or
total dissolved solids.
• Oil and grease which is not a single chemical; it comprises of
various organic compounds associated with hydrocarbons in
the formation.
• Organic as well as inorganic compounds introduced as
chemical additives to enhance drilling and production
activities.
• Radioactive materials that occur naturally and found its way
into the produced water from certain formations.
Materials and Methods
Conventional methods of produced water treatment
Numerous produced water treatment methods such as removal of heavy metals and other contaminants have been existence for the past few decades and are documented in the literature. These methods can be grouped into chemical, biological and physical processes with physical and chemical methods being common in the treatment of produced water. Chemical precipitation was the most widely used conventional method for removing heavy metals and other contaninants based on its effectiveness in treating inorganic waste streams based on acidity management in a basic solution [2]. However, the demerits of chemical precipitation are numerous; the discharge of large volume of sludge extracted would need additional treatment, reduction in metal precipitation, improper settling, the sludge of metal precipitates and the environmental effect thereafter on the sludge management.
Coagulation-flocculation may also be used to manage waste water with toxic and other heavy metals by introducing a coagulant during the process but this treatment may not stabilize any colloidal particle and may lead to sedimentation. Despite these methods being very expensive, they also cause challenges to the effective disposal of produced water for the practical management of water contaminated with heavy metals. The challenges that do arise during the conventional treatment which includes much intake of reagent and power, low selectivity issue, much operational cost and generation of more pollutants. In view of these issues, there is a need to search for alternative treatments to substitute the conventional technologies of removing heavy metals from polluted water sources. Among these standard methods are.
Membrance filtration: Membrance filtration is a good method of effluent management that can yield high quality effluent, in a wide range of conditions without encountering much problems along the line. Membrance eliminate solids, dissolved salts and other impurities from wastewater by channeling them through a semi-permeable membrane, concentrated waste is captured on the membrane surface.
Basic filtration and flotation: Basic filtration is mostly used in removing large solids materials from wastewater. Flotation is used to remove grease, oil and some suspended solids from wastewater.
Biological processes: Biological processes make use of bacteria to remove organic matter in produced water generally. They also remove ammonia from wastewater by nitrification and denitrification processes.
Management of produced water
This research suggests how the produced water is handled when it gets to the surface from the reservoir. Oil, gas and water flow into the separator and subsequently there is separation of water from the oil and gas [3]. Nearly all produced water is managed in the following ways, but not without some environmental effect.
• Injection of water into a hydrocarbon-bearing formation to
enhance hydrocarbon recovery.
• Disposal of produced water into a non-hydrocarbon-bearing
formation (depleted wells) through water injection wells.
• Evaporation
• Reuse during oil and gas operations (drilling fluids, fracture
fluids) and also general purposes.
Options available for managing produced water
Presented various options for managing produced water during oil and gas well production operations. The options include:
• Use of down hole separators which aids in separating water
from oil and gas and re-injecting it into a suitable formation.
This prevents or minimizes production of water to surface
lines. Polymer gels can also be used to block fissures that
contribute to produce water extraction.
• Re-injection of produced water into the same formation or
other suitable formations. Prior to produced water reinjection,
the water is first treated to reduce fouling, scaling
agents and bacteria. The treated water is conveyed from the
production site to the injection site.
• Discharge of produced water onshore and offshore such that
discharge limits are met. Although, some locations may not
require treatment before discharge.
• Re-use of wastewater for oil and gas operations-involves
managing the produced water to meet the quality required for
injecting it back for drilling and work-over activities.
Summary of research works on produced water
Aquatic plants such as duckweeds, water hyacinth and green algae (Chlorella vulgaris) were used in determining their viability for produced water purification. The plants were prepared and treated before use for produced water treatment. Parameters such as Chemical Oxygen Demand (COD), Biological Oxygen Demand (BOD) were considered in this work. Based on their result, COD and BOD were subsequently reduced in the PW by 43% and 42% respectively via duckweed, 28% and 33% respectively via water hyacinth and 33% and 38% via green algae [4]. Based on the results, duckweeds showed better efficiency in the removal of pollutants in comparison with other plants.
Phytoremediation method (treatment of wastewater using plants) was used in improving the treatment of produced water in Niger delta region. Phytoremediation process deals with de-polluting waste water, soil or air with plants which are able to contain, degrade or extract metals, pesticides, solvents as well as crude oil and its derivatives and some other pollutants from the sample. Their work showed the effectiveness of water hyacinth in the treatment of produced water as compared with that of a conventional method. Their comparison was based on assessing the quality of the discharged treated effluent and its impact on health and environment when discharged to the environment. Recent research work also considered the treatment of produced water with a sequential combination of locally sourced materials such as: Orange peels, sponge gourd, banana peels and palm kernel fibers and the results were also impressive.
Isehunwa and Onovae, carried out a study on the analysis of PW disposed in the Niger Delta region of Nigeria. Their study was aimed at investigating if oil companies observed environmental rules and regulations before discharging produced water. The PW samples were obtained from three flow stations and two oil terminals. The parameters analyzed were pH, resistivity, oil/grease content, copper, cadmium, iron, nickel, barium, manganese, lead, zinc, magnesium, chloride, sulphate, carbonate, bicarbonate, total dissolve solids, total suspended solids, Biochemical Oxygen Demand (BOD) and discharge temperature etc. Their research indicated that some parameters like chlorides, total dissolved solids, total suspended solids, iron and oil/grease content were above the standard limits as established by the regulatory bodies whereas the rest were within the limits.
Produced water, distilled water, beakers, measuring, cylinders, filter paper, reagents and some other laboratory glass wares were used in the research. Among the equipment used during this research were Atomic Absorption Spectrophotometer (AAS), fabricated adsorption column, sieving machine (mechanical shaker), milling machine, oven, etc.
The metals considered in this research were Manganese (Mn), Barium (Ba), Nickel (Ni), Magnesium (Mg), Chromium (Cr), Zinc (Zn), Calcium (Ca), Boron (B), Tin (Sn), Copper (Cu), Iron (Fe), Arsenic (As), Lead (pb), Cadmium (Cd) and some other impurities contained in the produced water sample.
Collection of sample and materials
The produced water sample was collected from Imo river oil field in Rivers state, Niger Delta. The adsorbent (orange peels) was collected from ABUAD farm in Ado-Ekiti, Ekiti state [5]. All the chemical reagents and other materials used in this research are of analytical grade (Figures 1 and 2).
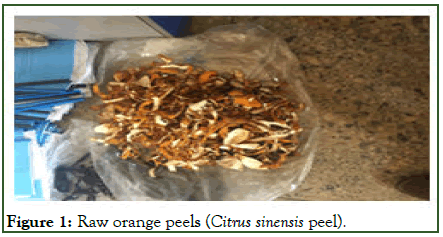
Figure 1: Raw orange peels (Citrus sinensis peel).
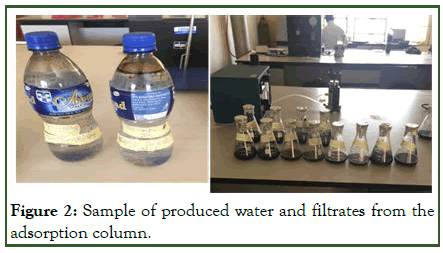
Figure 2: Sample of produced water and filtrates from the adsorption column.
Orange peels preparation and experimental steps
The orange peels were thoroughly washed with distilled water in other to evacuate unwanted particles (dirt) that may interfere with the result. It was cut into pieces, sun dried for four (4) days and oven dried for three (3) hours at 105°C. It was milled and sieved into 150 and 300 micron size, washed with dilute nitric acid to remove any pigment and subsequently dried for use as an adsorbent in the produced water samples tested. Orange peels were considered for this experiment because they are fibrous materials containing lignin and other functional groups responsible for the adsorption of metals and other contaminants from waste produced water (Figure 3).
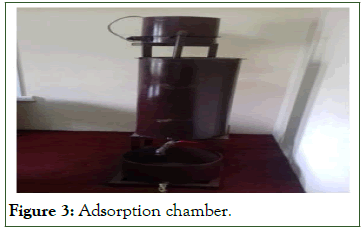
Figure 3: Adsorption chamber.
Use of the adsorbent for the treatment in the adsorption column
20 gram (150 micron size) of orange peels was measured and transferred into the first column of the adsorption chamber. This was followed by measuring 250 ml of the sample (produced water) collected from Imo river oil field. The sample was allowed to flow through the adsorption column containing the adsorbent to enable adsorption take place [6]. The filtrate emanated from the bottom of the chamber was collected at an interval of an hour and analyzed for the metal concentrations. The particle size of 150 micron was replaced with 300 micron of the same orange peels and the experiment was repeated, the filtrate was analyzed and the result recorded.
Results and Discussion
The result shown on Table 1 was obtained from the experiment performed in the adsorption chamber. The result from the sample was for 150 and 300 micron particle sizes.
| Sample R | pb | Ni | Cd | Cu | Fe | Mg | Cr | Zn | Mn | Ca | Ar | B | Sn | Ba |
|---|---|---|---|---|---|---|---|---|---|---|---|---|---|---|
| Raw | 0.132 | 0.036 | 0.014 | 0.076 | 0.552 | 3.699 | 0.071 | 0.125 | 0.062 | 430 | 4.65 | 1.59 | 0.155 | 0.038 |
| Post treatment with adsorbents using 150 micron particles size | ||||||||||||||
| 1 hrs | 0.112 | 0.034 | 0.014 | 0.074 | 0.481 | 3.556 | 0.066 | 0.124 | 0.059 | 398 | 4.43 | 1.49 | 0.129 | 0.038 |
| 2 hrs | 0.026 | 0.028 | 0.013 | 0.07 | 0.421 | 3.353 | 0.063 | 0.114 | 0.057 | 165 | 4.39 | 1.453 | 0.098 | 0.035 |
| 3 hrs | 0.011 | 0.024 | 0.008 | 0.009 | 0.323 | 3.12 | 0.033 | 0.068 | 0.052 | 58 | 3.92 | 1.37 | 0.069 | 0.026 |
| 4 hrs | 0.004 | 0.019 | 0.003 | 0.003 | 0.243 | 2.764 | 0.025 | 0.008 | 0.05 | 6.7 | 3.7 | 1.181 | 0.044 | 0.022 |
| Post treatment with adsorbents using 300 micron particle size | ||||||||||||||
| 1 hrs | 0.131 | 0.034 | 0.014 | 0.075 | 0.481 | 3.657 | 0.071 | 0.124 | 0.059 | 376 | 4.63 | 1.591 | 0.154 | 0.038 |
| 2 hrs | 0.13 | 0.033 | 0.011 | 0.074 | 0.452 | 3.576 | 0.069 | 0.123 | 0.057 | 302 | 4.61 | 1.574 | 0.152 | 0.035 |
| 3 hrs | 0.13 | 0.005 | 0.012 | 0.072 | 0.344 | 3.334 | 0.066 | 0.111 | 0.054 | 65 | 4.56 | 1.572 | 0.141 | 0.034 |
| 4 hrs | 0.127 | 0.004 | 0.005 | 0.067 | 0.314 | 2.71 | 0.063 | 0.014 | 0.041 | 9 | 4.52 | 1.57 | 0.134 | 0.031 |
Table 1: Result of the concentrations (mg/l) of the metals treated with orange peel (Sample R-Imo river sample).
Figure 4 is a plot of some of the concentrations of the metal against time after 4 hours of treatment. The metal concentrations plotted against time are Pb, Ni, Cd, Cu and Ba. The table also shows some other metal concentrations that were not captured on the plot.
The adsorbent used for this treatment was orange peels with 150 micron particle size. Previous works have not used such local materials for treatment of produced water (Table 2).
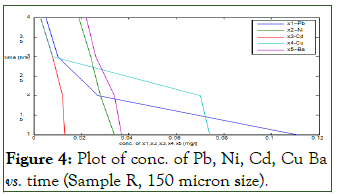
Figure 4: Plot of conc. of Pb, Ni, Cd, Cu Ba vs. time (Sample R, 150 micron size).
| T (hrs) | Ce (mg/l) | qe (g/l) | Ce/qe (g/l) | Log Ce (mg/l) | Log qe (g/l) |
|---|---|---|---|---|---|
| 1 | 0.11 | 0.000657 | 169.22 | -0.9546 | -3.1832 |
| 2 | 0.028 | 0.00328 | 8.233 | -1.5686 | -2.4848 |
| 3 | 0.011 | 0.00382 | 2.63 | -2 | -2.4191 |
| 4 | 0.005 | 0.00396 | 1.25 | -2.3011 | -2.4013 |
Table 2: Assessment of Pb (lead) using Langmuir and Freundlich isotherm models for sample R with orange peel.
The plot revealed that the more the time for the adsorption to take place, the more the metal concentrations on the sample reduces. The plot was a linear relationship. After 4 hours of treatment, the concentration of Pb, Ni, Cd, Cu and Ba were able to reduce from 0.132, 0.036, 0.014, 0.076, 0.038 (mg/l) to 0.005, 0.019, 0.003, 0.003 and 0.022 (mg/l) respectively [7]. Notable reductions in the concentration of other metals were as well achieved.
The result shows that Citrus sinensis peels are good adsorbent in the treatment of produced water as it was found to contain fibrous materials and other necessary functional groups responsible for the adsorption. The result obtained was also commendable as it was found to be within the discharge limits as set by the regulatory bodies.
Figure 5 is also a plot of some metals concentration against time. The same produced water (sample R) was used here as well as the same orange peels, but with particle size of 300 micron (Table 3). The metals concentration plotted against time on the figure were Pb, Ni, Cr, Zn and Ba. Their concentrations were found to reduce from 0.132, 0.036, 0.071, 0.125 and 0.038 to 0.128, 0.004, 0.064, 0.008 and 0.031 respectively after 4 hours of treatment in the chamber [8]. The plot is linear showing that the more the time taken for the adsorption process, the more the concentration of the toxic metals are reduced from the produced water. The table also shows some other metals concentration not plotted on the figure. The metals are Cd, Cu, Fe, Mg, Mn, Ca, Ar, B and Sn. Unlike the plotted ones, their concentrations were as well reduced to acceptable limits.
| t (hrs) | Ce (mg/l) | qe (g/l) | Ce/qe (g/l) | Log Ce (mg/l) | Log qe (g/l) |
|---|---|---|---|---|---|
| 1 | 0.033 | 6.26E-05 | 543 | -1.4684 | -4.2042 |
| 2 | 0.027 | 0.00024 | 112.1 | -1.5528 | -3.602 |
| 3 | 0.025 | 0.000376 | 64.2 | -1.6197 | -3.4259 |
| 4 | 0.019 | 0.000531 | 35.77 | -1.7211 | -3.3011 |
Table 3: Assessment of Ni (nickel) using Langmuir and Freundlich isotherm models for sample R with orange peel.
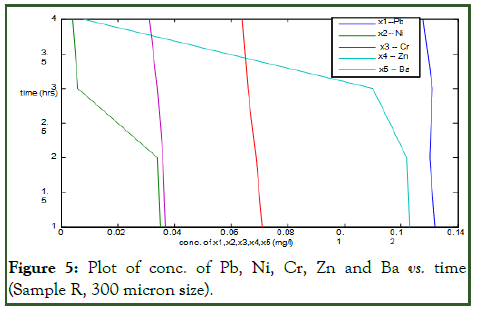
Figure 5: Plot of conc. of Pb, Ni, Cr, Zn and Ba vs. time (Sample R, 300 micron size).
Comparing the results from the two particle sizes (150 microns and 300 microns) as shown on the table and on the plots, one can confidently say that both particle sizes did a good job as they were able to bring down the concentration of the metals to allowable limits. The result obtained from 150 micron particle size was better than that of 300 micron particle size. The good result was as a result of the effect of surface area of the particles. From literature, it was stated that the smaller the particles, the larger the surface area and the better the adsorption process. The result obtained from the analysis conformed to the literature as it could be seen that 150 micron particle size with large surface area gave a better result than 300 micron particle size with smaller surface area.
For an efficient and effective adsorption process using some of these low cost agricultural wastes, the particle size should be made as smaller as possible so as to ensure larger surface area [9]. The large surface area of the particles exposes very well the adsorption sites and the necessary functional groups responsible for the adsorption. For the 150 micron size, the percentage reductions for the metals concentration (Pb, Ni, Cd, Cu, Fe, Mg, Cr, Zn, Mn, Ca, Ar, B, Sn, Ba) were found to be 92.21%, 47.22%, 78.57%, 96.05%, 55.79%, 25.28%, 64.79%, 93.60%, 19.35%, 98.42%, 20.43%, 24.79%, 71.61%, 42.11% respectively.
Results analysis based on adsorption isotherms
The Langmuir model: This isotherm model explains the relationship between the quantity of materials extracted and its equilibrium concentration within bulk solutions.
Langmuir isotherm model is satisfactory for monolayer adsorption on a surface that contains a certain fixed number of similar sites (Table 4). Langmuir sorption model assumes a uniform adsorption on the surface and transmigration in the surface plane. Langmuir isotherm model could be defined as:

where qe is the adsorption capacity at equilibrium in (mg/g), Ce: the equilibrium concentration (mg/l) and KL is the Langmuir constant in (ml/mg).
| t (hrs) | Ce (mg/l) | qe (g/l) | Ce/qe (g/l) | Log Ce (mg/l) | Log qe (g/l) |
|---|---|---|---|---|---|
| 1 | 0.479 | 0.00224 | 213.32 | -0.3189 | -2.6479 |
| 2 | 0.421 | 0.00413 | 101.68 | -0.3767 | -2.3840 |
| 3 | 0.324 | 0.00717 | 45.11 | -0.5228 | -2.1452 |
| 4 | 0.243 | 0.00962 | 25.33 | -0.6125 | -2.0456 |
Table 4: Assessment of Fe (iron) using Langmuir and Freundlich isotherm models for sample R with orange peel.
The Freundlich model
The Freundlich model is a unique model which considers the occurrence of the adsorption process on heterogeneous surfaces; and the model also highlights that capacity of adsorption is related to the concentration of the adsorbent [10]. The Freundlich isotherm model could be expression as:

Note KF is the Freundlich constant and 1/n is a constant showing the intensity of reaction. These freundlich parameters KF and 1/n can be graphically estimated from the plot of experimental values and then applying the freundlich equation in this form:

Considering the treatment of sample R with orange peel, the linear plot of ce/qe vs. ce indicates that adsorption of Pb ion obeys the Langmuir adsorption model (Figure 6). Values of Q, b, kL and RL determined from the plot are indicated on (Table 5). The coefficient of correlation (R2) shown on the plot was 0.9761 for Langmuir model and 0.8123 for Freundlich model (Figure 7). The results showed that the Langmuir model is favourable for study on the equilibrium of Pb and this indicates the formation of monolayer coverage of the adsorbate on the adsorbent surface for the metal ion.
The amount of metal ion extracted per unit mass of the adsorbent rises with the metal concentration as expected [11]. The equilibrium separation factor RL of 0.809 (Table 5) indicated that the sorption of Pb ion on the adsorbent surface (orange peel) was found to be a favorable process (Figure 8).
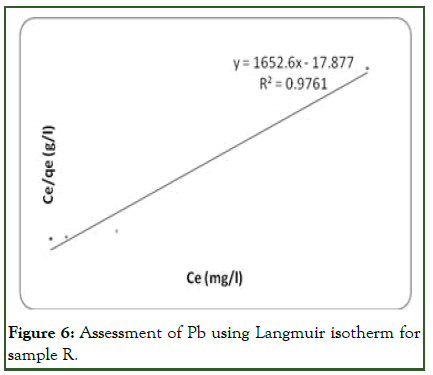
Figure 6: Assessment of Pb using Langmuir isotherm for sample R.
| Metal | Langmuir model | Freundlich model | ||||||
|---|---|---|---|---|---|---|---|---|
| 1 | R2 | b | KL | RL | Qo | R2 | n | KF |
| Pb | 0.98 | 1.78 | 0.00559 | 0.809 | 0.00313 | 0.81 | 8.84 | 1.2 |
| Ni | 0.78 | 11.29 | 0.00133 | 0,711 | 0.000119 | 0.85 | 0.57 | 1.38 |
| Fe | 0.86 | 1.44 | 0.00334 | 0.557 | 0.00232 | 0.93 | 0.698 | 1.11 |
Table 5: A comparism of coefficient of determination and other parameters for treatment with orange peel with sample R using the two models.
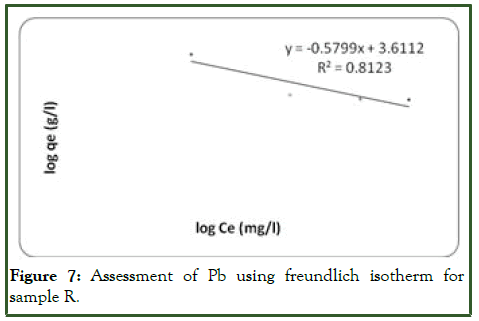
Figure 7: Assessment of Pb using freundlich isotherm for sample R.
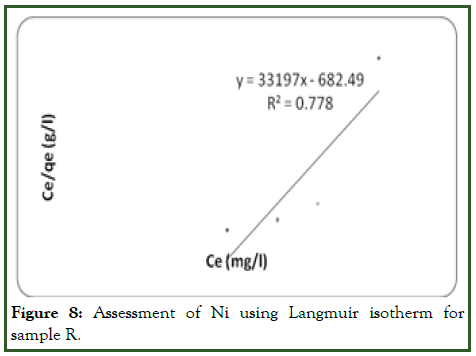
Figure 8: Assessment of Ni using Langmuir isotherm for sample R.
Considering Ni ion adsorption on the adsorbent surface, the linear plot of log qe vs. log ce indicates that adsorption obeys the Freundlich model (Figure 9). The correlation coefficient (R2) was found to be 0.8462 which is more favorable than Langmuir with 0.778 (Figure 10). This shows that the Freundlich sorption isotherm is favouable for equilibrium study for Ni and this indicates the formation of heterogeneous layer coverage of the adsorbate on the adsorbent surface for the metal ion. The values of kf and n were determined from the plot as shown on Table 5. These values shows that the adsorption process was a favorable one. Hence forth, the Freundlich model best describe the adsorption of Ni on the adsorbent surface.
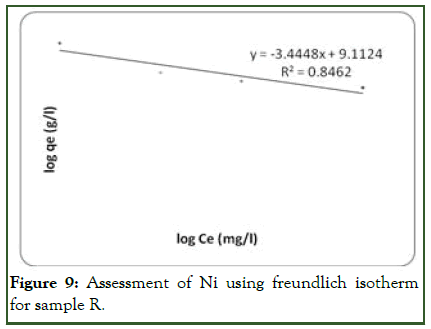
Figure 9: Assessment of Ni using freundlich isotherm for sample R.
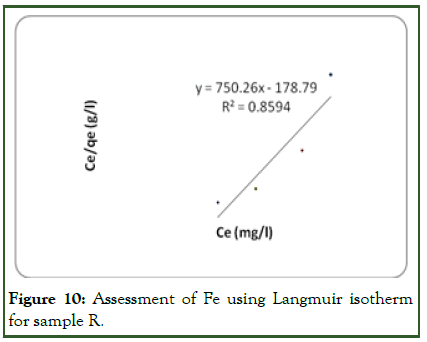
Figure 10: Assessment of Fe using Langmuir isotherm for sample R.
For Fe (iron) adsorption on the adsorbent surface, Freundlich isotherm model gives a better result when compared with Langmuir model. The linear plot of log qe vs. log ce indicates that adsorption obeys the Freundlich adsorption isotherm (Figure 11). The correlation coefficient (R2) shown on the plot was found to be 0.9341. This shows that the Freundlich sorption model is favourable for equilibrium study for Fe compared with R2 of 0.8594 on the Langmuir plot (Figure 10). This indicates that the formation of heterogeneous layer coverage of the adsorbate on the adsorbent surface for the metal ion. The values of kf and n as calculated from the plot are shown on (Table 5).
These values indicate that the sorption of Fe on the surface of the adsorbent is a favorable process. Therefore, Freundlich model best describes the adsorption of Fe on the adsorbent surface.
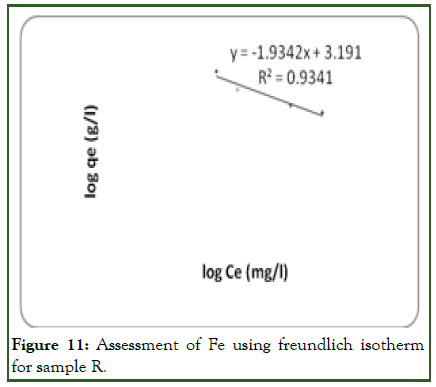
Figure 11: Assessment of Fe using freundlich isotherm for sample R.
Conclusion
The samples of produced water obtained from Niger Delta region of Nigeria were analyzed in this research and was discovered to contain some portions of heavy metals. The experimental procedures used in the analysis of these metals were done with standard solution of each metal prepared at room temperature in the laboratory. The experiments were successful; the metal concentrations before and after treatment with the adorsobent were analyzed with the help of an atomic absorption spectrophotometer.
Before the treatment, the analysis indicated that the concentration of the metals in the sample was in excess of what was expected before discharge or re-use as the case may be. Following the treatment using the adsorbent (Citrus sinensis peel), the concentration of most of the metals were reduced to expected limits as set by the regulatory bodies. 150 micron size of the adsorbent produced a good result compared with 300 micron size. It was noted that the finer the particles, the better the adsorption. The result from 150 micron size highlighted percentage reductions for the metals concentration (Pb, Ni, Cd, Cu, Fe, Mg, Cr, Zn, Mn, Ca, Ar, B, Sn, Ba) were found to be 92.21%, 47.22%, 78.57%, 96.05%, 55.79%, 25.28%, 64.79%, 93.60%, 19.35%, 98.42%, 20.43%, 24.79%, 71.61%, 42.11%respectively.
Two models were used to validate the result obtained from the analysis. These models were Langmuir and freundlich isotherm models. The three metals selected for the test were lead (Pb), Nickel (Ni) and Iron (Fe). The models proved that the results obtained from the analysis were valid.
Acknowledgement
The support of the laboratory staff of the department of petroleum engineering, Afe Babalola university Ado-Ekiti, Ekiti state is acknowledged.
References
- Aharoni C, Ungarish M. Kinetics of activated chemisorption. Part 2-Theoretical models. J Chem Soc. 1977;73:456-464.
- Sasmaz A, Obek E. The accumulation of arsenic, uranium and boron in Lemna gibba L. exposed to secondary effluents. Ecoll Eng. 2009;35(10):1564-1567.
- Al-Anber ZA, Matouq MA. Batch adsorption of cadmium ions from aqueous solution by means of olive cake. J Hazard Mater. 2008;151(1):194-201.
[Crossref] [Google Scholar] [PubMed]
- Allen SJ, Brown PA. Isotherm analyses for single component and multi‐component metal sorption onto lignite. J Chem Technol Biotechnol. 1995;62(1):17-24.
- Altundogan HS, Bahar N, Mujde B, Tumen F. The use of sulphuric acid-carbonization products of sugar beet pulp in Cr (VI) removal. J Hazard Mater. 2007;144(1-2):255-264.
[Crossref] [Google Scholar] [PubMed]
- Ibrahim TH, Gulistan AS, Khamis MI, Ahmed H, Aidan A. Produced water treatment using naturally abundant pomegranate peel. Desalin Water Treat. 2016;57(15):6693-6701.
- Annadurai G, Juang RS, Lee DJ. Adsorption of heavy metals from water using banana and orange peels. Water Sci Technol. 2003;47(1):185-190.
[Crossref] [Google Scholar] [PubMed]
- Ayawei N, Ebelegi AN, Wankasi D. Modelling and interpretation of adsorption isotherms. J Chem. 2017;2017(1):3039817.
- Bulut Y, Gozubenli N, Aydın H. Equilibrium and kinetics studies for adsorption of direct blue 71 from aqueous solution by wheat shells. J Hazard Mater. 2007;144(1-2):300-306.
[Crossref] [Google Scholar] [PubMed]
- Gregory KB, Vidic RD, Dzombak DA. Water management challenges associated with the production of shale gas by hydraulic fracturing. Elements. 2011;7(3):181-186.
- Gunatilake SK. Methods of removing heavy metals from industrial wastewater. Methods. 2015;1(1):14.
Citation: Udeagbara SG, Isehunwa SO, Okereke NU, Nwanwe O,Oguama I, Kerunwa A (2024) Adsorptive Removal of Heavy Metals from Oil Well Produced Water Using Citrus sinensis Peel. J Pet Environ Biotechnol. 15:575.
Copyright: © 2024 Udeagbara SG, et al. This is an open-access article distributed under the terms of the Creative Commons Attribution License, which permits unrestricted use, distribution, and reproduction in any medium, provided the original author and source are credited.
