Indexed In
- Open J Gate
- The Global Impact Factor (GIF)
- Open Archive Initiative
- VieSearch
- International Society of Universal Research in Sciences
- China National Knowledge Infrastructure (CNKI)
- CiteFactor
- Scimago
- Ulrich's Periodicals Directory
- Electronic Journals Library
- RefSeek
- Directory of Research Journal Indexing (DRJI)
- Hamdard University
- EBSCO A-Z
- Publons
- Google Scholar
Useful Links
Share This Page
Journal Flyer
Open Access Journals
- Agri and Aquaculture
- Biochemistry
- Bioinformatics & Systems Biology
- Business & Management
- Chemistry
- Clinical Sciences
- Engineering
- Food & Nutrition
- General Science
- Genetics & Molecular Biology
- Immunology & Microbiology
- Medical Sciences
- Neuroscience & Psychology
- Nursing & Health Care
- Pharmaceutical Sciences
Research Article - (2020) Volume 10, Issue 1
A Feasibility Study to Convert Steel Industry Solid Waste into a Red Oxide Primer
Satyanarayana SV1* and Ahmed H Al-Balushil22Department of Civil and Environmental Engineering, National University of Science and Technology, Muscat, Oman
Received: 03-Feb-2020 Published: 16-Feb-2020, DOI: 10.35248/2252-5211.20.10.374
Abstract
The steel industries generate a high volume of solid waste each year. The disposal of solid waste is a Hercules task for steel industry management. The solid waste contains heavy metals like iron, chromium, lead, zinc and toxic chemical compounds. The solid waste disposal contributes for ground water pollution and soil pollution. The steel industry solid waste contains a high percentage of iron oxide more than 12%. The aim of this project is to convert steel industry solid waste into a red oxide primer. The solid waste samples are collected from a local steel industry. The samples are crushed and passed through a 53 micron mesh to get fine powder. The powder is mixed with Long oil alkyd, calcium carbonate and Butanol. The mixture mixed intensively by the help of a wet grinder until it gets adhering properties and become as a primer. The adhesive properties of the primer is tested by painting on a metal surface and after drying the primer on the metal surface and tested by the peeling method to check the strength of the primer. The primer viscosity modified by adding turpentine oil. The red oxide primer used as a dielectric or pre-coating on iron structure. It was observed that the red oxide produced by using steel industry solid waste is at par with commercially available red-oxide primer. The red oxide primer production from the steel industry sludge is technically feasible and economically viable.
Keywords
Long oil alkyd; Primer; Red oxide; Heavy oil; Butanol; Pre-coating; Dielectric
Introduction
The solid waste management is an essential service [1]. The development of any country is measured by its steel production. The steel industry is the backbone for infrastructure development and industrial development. The steel liquid is produced by melting the iron ore at 1600°C in a blast furnace. The liquid iron is transferred and molded in to steel rods, pipes and sheets. The bottom settled solid waste in the blast furnace is collected separately for disposal.
Steel industry consumes 1.44 ton of iron ore to produce 1 ton of steel. As per world steel association they use waste management plan (WMP) and applied the principle of reuse, reduction and recycling (3 ‘R’s) in steel industry. These above two methods help to reduce the raw materials consumption to 1.23 ton of iron ore to produce 1 ton of steel. As a result, the solid waste generation decreased to 21%. [2]. In the steel plant, the solid waste is generated from blast furnace process, basic oxygen furnace, electric arc furnace, stainless steel refining, and casting and milling process [3]. The steel plant producing 3000 ton per day generates 630 of solid waste per day. The disposal of solid waste occupies some area of land. It was observed in some industries the solid waste deposits were looking like a mountains. The chemical analysis of steel slag shows that the iron content varies from 32% to 37% [4]. At present, the steel plant steel slag has been utilized as an aggregate for road construction, cement and concrete production [5]. The solid waste should be used as a raw material for some other industry. There is a need to utilize reuse and recovery technologies to make the industry into a zero solid waste discharge units. The solid waste from the steel industry has been used for slag atomization, rail ballast, road and pavement material, filling material, cement production, as a substitute for sinter flux, bricks production, and as a soil conditioner [6]. The sustainable steel making goals are conservation of natural resources, reduction of greenhouse gases, reduction of volatile gases and reduction of hazardous waste [7]. The blast furnace slag and the steel melting shops slag contains more iron than other solid wastes from the steel industry [8]. Millions of tons of iron is lost due to corrosion every year. There is ample scope to recover value added metals from the LD furnace slag [9]. Different technologies are available to protect the iron from the corrosion. The iron rods are dipped in the hot melted zinc. The zinc acts as an anode and protects the iron from corrosion. The best way to protect the iron from corrosion is anodic protection [10]. The best examples of natural pigments are iron oxide, titanium dioxide and zirconium dioxide. Iron oxide can be used as a pigment. Experimental studies conducted with iron oxide Nano particles to reduce corrosion. In presence of poly ethylene glycol, the iron oxide Nano particles reduced the corrosion rate [11]. The calcium carbonate is the most preferred filler. It provides glossy finish, easy brushing and viscosity [12]. A study was conducted by replacing calcium carbonate with rice husk ash in red oxide primer. It was observed that rice husk ash can be used as a replacement to the calcium carbonate without compromising the quality of red oxide primer [13]. The calcium carbonate can be added as a pigment extended material. It is used as a filler material in paint manufacturing process. The calcium carbonate is available in plenty and cheap. Another advantage is its adhesive properties. The calcium carbonate is preferred for its glossy bright white and for smooth brushing. [14]. A polymer compound alkyd resin mixed with sunflower oil and stirred to get adhesive properties. High alkalinity has a better corrosion resistant property [15]. Any colored metal oxide can be used as a natural pigment.
Materials and Methods
The solid waste from the local steel industry collected. The solid waste is crushed by a hammer to make 6 mm to 10 mm size stones and transferred in to a ball mill. The solid waste is grinded for 30 minutes to make powder. The powder sieved by passing through a 53 micron sieve to get fine powder. The solid waste is mixed with long oil alkyd resin and stirred for 30 minutes in a wet grinder to make in to a red oxide primer.
The calcium carbonate stones are collected and made in to a powder and passed through 53 micron sieve to get fine powder. The calcium carbonate powder is mixed with butanol and introduced in to the wet grinder and mixed until the primer gets adhesive properties. The viscosity of the red oxide primer is adjusted either by adding castor oil or turpentine oil. To increase the viscosity castor oil is used and to decrease the viscosity turpentine oil is used. The red oxide process flow diagram is shown in Figure 1. The produced red oxide primer is tested for adhesive properties with peeling effect, pH and viscosity.
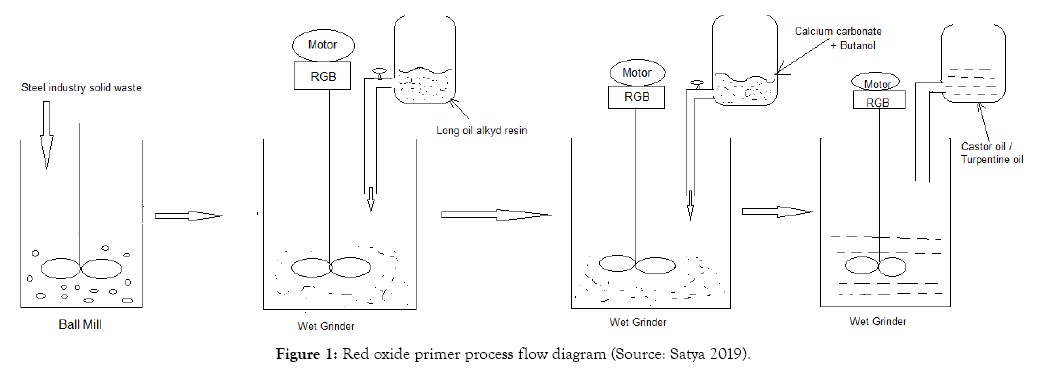
Figure 1: Red oxide primer process flow diagram (Source: Satya 2019).
The solid waste samples from different locations are collected and analyzed for iron, nickel and chromium. A composite sample prepared by mixing all the 10 samples. From the composite sample 20 grams, 25 grams, 30 grams, 35 grams and 40 grams samples are taken to produce red oxide primer.
Analysis of solid waste samples for iron, nickel and chromium. The metals nickel and chromium have corrosion resistant properties. The samples are analyzed in an Inductively Coupled Plasma Spectrophotometer (ICP) and the results are shown in Table 1, and Figure 2. The quality of red iron oxide depends on the ferrous content of the steel industry solid waste. The iron content of the solid waste samples are shown in Table 2 and Figure 3.
| Sample No | Ferrous iron (mg/L) | Nickel (mg/L) | Chromium (mg/L) |
|---|---|---|---|
| Sample 1 | 434 | 4.6 | 5.59 |
| Sample 2 | 397 | 4.33 | 5.34 |
| Sample 3 | 391 | 11.3 | 5.3 |
| Sample 4 | 403 | 4.61 | 6 |
| Sample 5 | 425 | 5.04 | 5.38 |
| Sample 6 | 1000 | 5.19 | 7.37 |
| Sample 7 | 855 | 11.2 | 15.3 |
| Sample 8 | 886 | 10.3 | 14.1 |
| Sample 9 | 867 | 21 | 22.6 |
| Sample 10 | 923 | 35.3 | 31.2 |
Table 1: Analysis of solid waste samples for Fe, Ni and Cr metals.
| Sample No | Percentage of Fe % |
|---|---|
| Sample 1 | 8.68 |
| Sample 2 | 7.94 |
| Sample 3 | 7.82 |
| Sample 4 | 8.06 |
| Sample 5 | 8.5 |
| Sample 6 | 20 |
| Sample 7 | 17.1 |
| Sample 8 | 17.7 |
| Sample 9 | 17.4 |
| Sample 10 | 18.5 |
Table 2: Percentage of ferrous oxide in different solid waste samples.
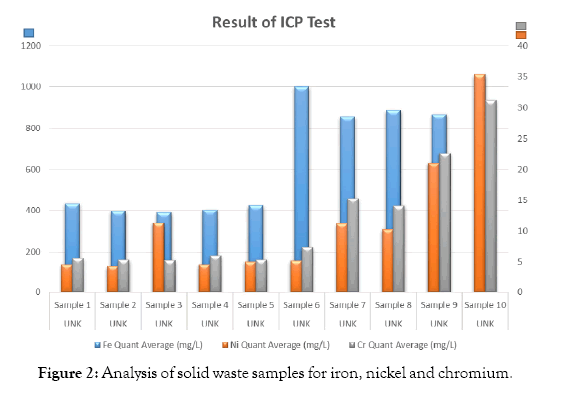
Figure 2: Analysis of solid waste samples for iron, nickel and chromium.
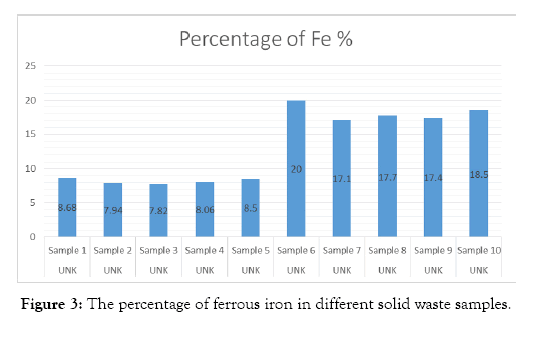
Figure 3: The percentage of ferrous iron in different solid waste samples.
The compositions of Red Oxide Primer (ROP) samples are shown in Tables 3-7 and Figures 4-8.
| Component | Material in grams | Percentage % |
|---|---|---|
| Steel Plant Solid Waste | 20 | 9.4 |
| Calcium Carbonate | 160 | 75.1 |
| Long Oil Alkyd | 30 | 14.1 |
| N –Butanol | 3 | 1.4 |
| Total weight | 213 |
Table 3: Solid waste sample-1.
| Component | Material in grams | Percentage % |
|---|---|---|
| Steel Plant Solid Waste | 25 | 10.7 |
| Calcium Carbonate | 170 | 72.6 |
| Long Oil Alkyd | 35 | 15 |
| N –Butanol | 4 | 1.7 |
| Total weight | 234 |
Table 4: Solid waste sample-2.
| Component | Material in grams | Percentage % |
|---|---|---|
| Steel Plant Solid Waste | 30 | 11 |
| Calcium Carbonate | 200 | 73 |
| Long Oil Alkyd | 40 | 14 |
| N –Butanol | 5 | 2 |
| Total weight | 275 |
Table 5: Solid waste sample-3.
| Component | Material in grams | Percentage % |
|---|---|---|
| Steel Plant Solid Waste | 35 | 11.6 |
| Calcium Carbonate | 210 | 69.8 |
| Long Oil Alkyd | 50 | 16.6 |
| N –Butanol | 6 | 2 |
| Total weight | 301 |
Table 6: Solid waste sample-4.
| Component | Material in grams | Percentage % |
|---|---|---|
| Steel Plant Solid Waste | 40 | 12.3 |
| Calcium Carbonate | 220 | 68.1 |
| Long Oil Alkyd | 55 | 17.1 |
| N –Butanol | 8 | 2.5 |
| Total weight | 323 |
Table 7: Solid waste sample-5.
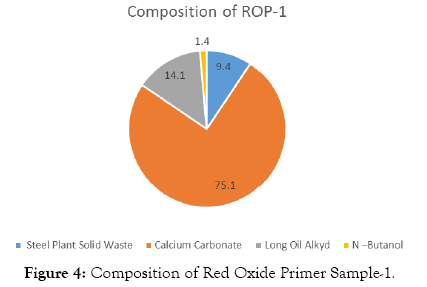
Figure 4: Composition of Red Oxide Primer Sample-1.
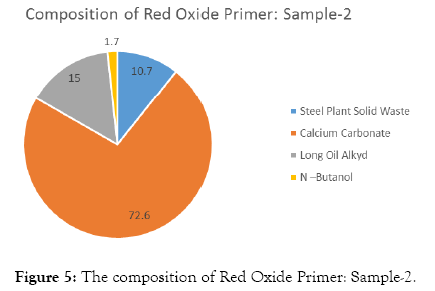
Figure 5: The composition of Red Oxide Primer: Sample-2.
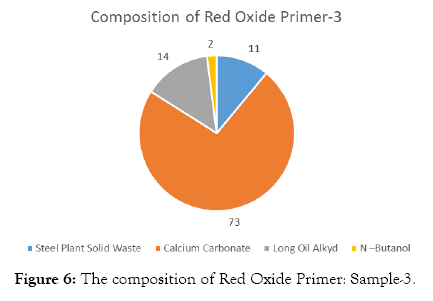
Figure 6: The composition of Red Oxide Primer: Sample-3.
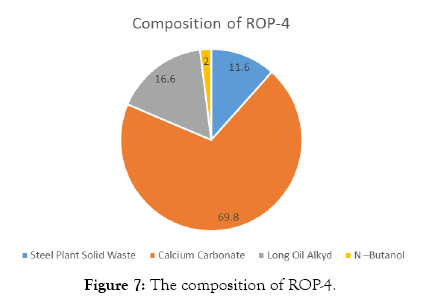
Figure 7: The composition of ROP-4.
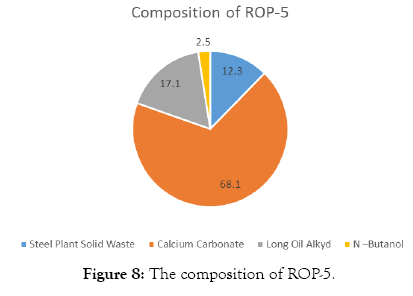
Figure 8: The composition of ROP-5.
Quality testing of red oxide primer samples are shown in Figures 9 and 10. The results of pH test are shown in Table 8 and Figure 11. Results of viscosity test by using Krebs Viscometer are given in Table 9 and Figure 12. Results of viscosity test by using cone and plate viscometer are given in Table 10 and Figure 13.
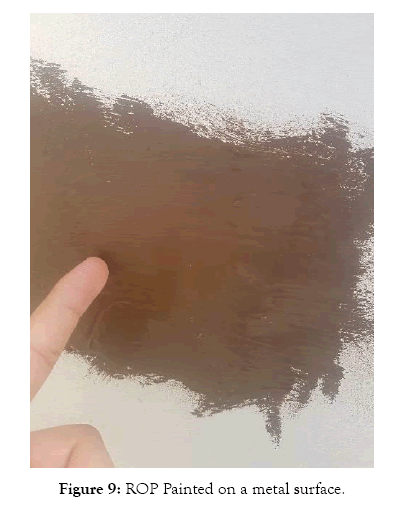
Figure 9: ROP Painted on a metal surface.
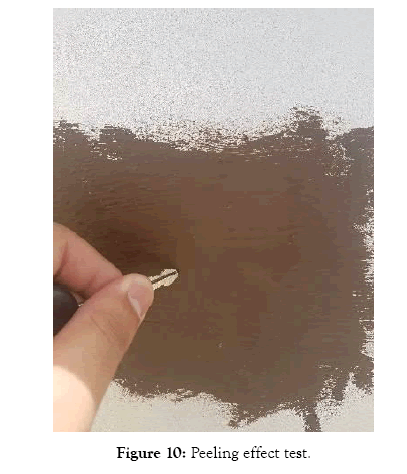
Figure 10: Peeling effect test.
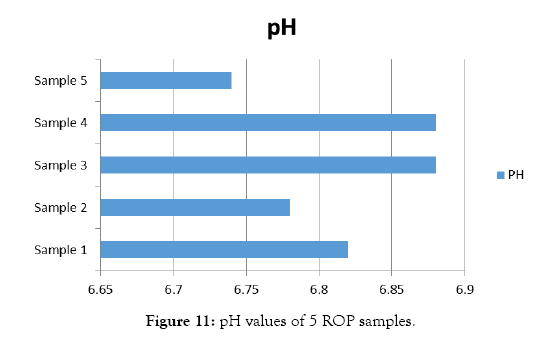
Figure 11: pH values of 5 ROP samples.
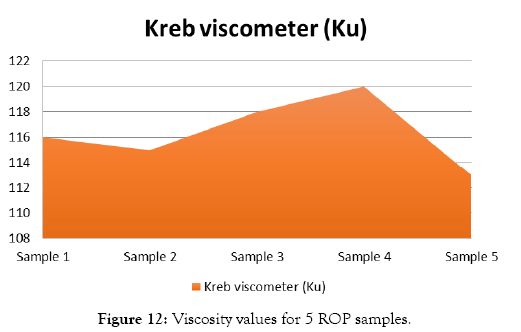
Figure 12: Viscosity values for 5 ROP samples.
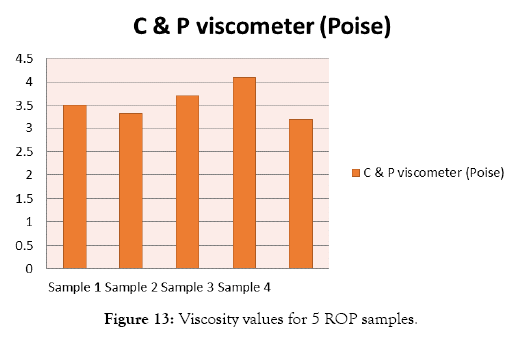
Figure 13: Viscosity values for 5 ROP samples.
| Test | Sample 1 | Sample 2 | Sample 3 | Sample 4 | Sample 5 |
|---|---|---|---|---|---|
| PH | 6.82 | 6.78 | 6.88 | 6.88 | 6.74 |
Table 8: Results of pH test for 5 sample of primer
| Test | Sample 1 | Sample 2 | Sample 3 | Sample 4 | Sample 5 |
|---|---|---|---|---|---|
| Kreb viscometer | 116 ku | 115 ku | 118 ku | 120 ku | 113 ku |
Table 9: Results of Viscosity test by using Krebs
| Test | Sample 1 | Sample 2 | Sample 3 | Sample 4 | Sample 5 |
|---|---|---|---|---|---|
| C & P viscometer (Poise) | 3.5 | 3.32 | 3.7 | 4.1 | 3.2 |
Table 10: Results of Viscosity test by using Cone & Plate Viscometer.
Conclusion
The steel industry should adopt 4R technologies for sustainable development. There is ample scope to convert steel plant solid waste in to a raw material to produce red oxide primer. The iron content in the solid waste samples varied from 7.82% to 20.0%. The red color of the primer is directly proportional to its iron content. The adhesive properties depends on the calcium carbonate content and the long oil alkyd resin. The most preferred percentage is more than 70% w/w. The thinner is used to reduce the viscosity. The pH of the ROP is varied from 6.7 to 6.9. The adhesive property was tested by the peeling effect. The produced ROP has excellent adhesive property.
The solid waste from the steel industry was converted successfully in to the red oxide primer with good quality. The peeling test, adhesiveness and strength were satisfactory. It contributes to the production of value added product red oxide primer from the solid waste. As a result the profitability of steel industry increases. The ROP reduces the generation of solid waste and protects the environment.
Conflicts of Interest
The authors have no conflicts of interest.
Acknowledgement
The authors are thankful to the management of Jindal Shadeed Iron and Steel LLC, Sohar for providing the solid waste samples to carry out this project. Special thanks are also due to the management of Khimji Paints LLC, Rusayl, Muscat for allowing to test the properties of red oxide primer samples in their industry.
REFERENCES
- Rick L. An Introduction to Solid Waste Management. Sustainable Businesses. 2016
- Satyendra. Waste Disposal and Recycling In Steel Industry. 2014
- Mukuldev Khunte. Process Waste Generation and Utilization in Steel Industry. International Journal of Industrial and Manufacturing Systems Engineering. 2018;3:1-5
- Ikmal Hakem A Aziz, Khairunnisa binti Zulkifly, Konstantinos Miltiadis Sakkas, Dimitrios Panias. The Characterization of Steel Slag by Alkali Activation. Open Access Library Journal. 2017;4:1-13
- Huang Yi, Guoping Xu, Huigao Cheng, Junshi Wang, Yinfeng Wan, et al. An overview of utilization of steel slag. The 7th International Conference on Waste Management and Technology. Procedia Environmental Sciences. 2012;16:791–801
- Adhikarla Baba Srinivas, Santosh Kumar Sar, Shwetha Singh, Santosh Yadav. Solid waste management from steel melting shop. Journal of Applied and Advanced Research. 2017;21:48-55
- Marzena Smol. Towards Zero Waste in Steel Industry-Polish Case Study. Journal of Steel Structures & Construction. 2015;1:1-6
- Sushovan Sarkar, Debabrata Mazumder. Solid Waste Management in Steel Industry Challenges and Opportunities. International Journal of Social, Behavioral, Educational, Economic, Business and Industrial Engineering. 2015;9:978-981
- Chand Sasmita, Paul. Biswajit. An Overview on Steel Plant Waste Management in India. Text book of Strategic Technologies of Complex Environmental Issues-A Sustainable Approach. 2014:23-27
- Bruno D, Gian L. Environmental Sustainability of Steel Active Corrosion Protection Processes. Materials Transactions. 2003;44:1262-1265
- Pavani Katikaneani, Ajay Kumar Vaddepally, Narender Reddy Tippana, Ramu Banavath, Srivani Kommu. Phase Transformation of Iron Oxide Nanoparticles from Hematite to Magnetite in Presence of Polyethylene Glycol: Application as Corrosion Resistant Nanoparticle Paints. Journal of Nano science. , 2016;16:01-06
- Clementina D, Igwebike-Ossi1, Nwabueze I Elom. Flatting Effect of Rice Husk Ash in Red Oxide Primer in Comparison with Calcium Carbonate. IOSR Journal of Applied Chemistry (IOSR-JAC). 2016;9:63-68.
- Dhara S, Kumar S. Management of Solid Waste for Sustainability of Steel Industry. HCTL Open International Journal of Technology Innovations and Research (IJTIR). 2015;16:01-06
- Igwebike Ossi, Clementine Dilim. Comparative Evaluation of Pigment-Extender Effects of Calcium Carbonate and Kaolin in Emulsion Paint. International Journal of Science and Technology (IJST). 2015;4:570-578
- Ayman M Atta, Rasha A El-Ghazawy, Ashraf M El-Saeed. Corrosion Protective Coating Based on Alkyd Resins Derived from Recycled Poly (ethylene terephthalate) Waste for Carbon steel. Intentional Journal of Electrochemical Science (IJES). 2013;8:5136-5152.
Citation: Satyanarayana SV, Al-Balushil AH (2020) Removal of Polyphenols from Olive Mill Wastewater by FPX 66 Resin: Part II. Adsorption Kinetics and Equilibrium Studies. Int J Waste Resour 10:374. doi: 10.35248/2252-5211.20.10.374
Copyright: © 2020 Satyanarayana SV, et al. This is an open-access article distributed under the terms of the Creative Commons Attribution License, which permits unrestricted use, distribution, and reproduction in any medium, provided the original author and source are credited.
