Citations : 2345
Dentistry received 2345 citations as per Google Scholar report
Indexed In
- Genamics JournalSeek
- JournalTOCs
- CiteFactor
- Ulrich's Periodicals Directory
- RefSeek
- Hamdard University
- EBSCO A-Z
- Directory of Abstract Indexing for Journals
- OCLC- WorldCat
- Publons
- Geneva Foundation for Medical Education and Research
- Euro Pub
- Google Scholar
Useful Links
Share This Page
Journal Flyer
Open Access Journals
- Agri and Aquaculture
- Biochemistry
- Bioinformatics & Systems Biology
- Business & Management
- Chemistry
- Clinical Sciences
- Engineering
- Food & Nutrition
- General Science
- Genetics & Molecular Biology
- Immunology & Microbiology
- Medical Sciences
- Neuroscience & Psychology
- Nursing & Health Care
- Pharmaceutical Sciences
Research Article - (2020) Volume 10, Issue 6
A Comparative Study to Evaluate the Surface Quality of Erbium Dental Lasers with Conventional Bur Preparation Followed by the Microleakage Assessment of the Composite and Cerec Cad-Cam Restored Cavities
Mudasser Iqbal*Received: 01-Jul-2020 Published: 01-Aug-2020, DOI: 10.35428/2161-1122.20.10.562
Abstract
The surface quality of the prepared tooth strongly contributes to the longevity of the filling material and protection against caries. Restoration failure and development of incipient caries under the restoration are one of the major problems we face in our old dental practice despite our utmost struggle. This problem was never addressed until the introduction of modern technology that revealed the mystery behind the failure. With the new modern laser technology, we can overcome the problem at ease. Dental hard tissue laser prepares the cavities through the process called “Water Mediated Ablation”. It has the advantages over the conventional bur preparation by removing any debris such as smear layer and bacterial colonies within the dentinal tubules. This paper therefore, is a comparative study that examines the surface quality of the teeth cavities prepared with two high-end dental lasers Er: YAG, Er, Cr: YSGG with the conventional handpiece bur. Same settings were used for both hard tissue Er: YAG and Er, Cr: YSGG lasers. The surface quality of prepared cavities was examined under an electron microscope. Restoration is made using the state of the art CEREC Cad-Cam system and conventional nano-composite filling material. Cavities were scored for microleakage after thermocycling and dye penetration test. This penetration test contributes to nearly 10 years of stress in the normal oral environment. The microleakage was then examined under a leica microscope. The surface quality of the cavities prepared with both dental hard tissue lasers was clear of smear layer promising the longevity and durability of the restoration and declining of incipient caries. Convention preparation showed smear layer and obstruction of dentinal tubules preventing the bonding material to penetrate and seal leading to the future development of incipient caries and dislodgements.Keywords
Dental lasers; Conventional bur preparation; Microleakage; Cad-cam restored cavities
Introduction
State of the art dental burs
There are strong shreds of evidence of dental practice since 7000 BC [1]. When the tooth gets decayed, the decayed part must be excavated. In the past pick and enamel, scissors were used to remove the decayed tissue [2]. Figure 1 shows a patient being treated in Europe since 1611 [3]. Bennion E invented the first mechanical dental engine that allows the patients to view the dentistry as a promising profession [4]. The speed of the dental drill was slow 2,000 rpm approximately, that involved several hours to finish the procedure. RB Black published an article on mechanical preparation using the air-abrasive technique, a new approach to tooth preparation [5]. Figure 2 [3,6] shows the archimedean drill used for dental treatment from the 19th century. Air-driven highspeed handpiece was introduced in 1957. This handpiece rotates at the speed of 300,000 rpm. In 1960 the speed of the handpiece was increased up to 500,000 rpm. That enhances the cutting efficiency of the dental tissue [7]. More studies were conducted to develop a more convenient and efficient method of cutting dental tissue. Some of the studies include the use of electric operated drills to prepare cavities (SONICSYS micro, KaVo, Lake Zurich, IL). They improved the cutting efficiency even in the areas which were difficult to access [8,9]. Chemo-mechanical devices (Carisolv, MediTeam, Savedalen, Sweden) were introduced in a dental practice that used a gel and a hand instrument for removing dental decay. Air abrasive kinetic systems (e.g. RONDOflex, KaVo, Lake Zurich, IL) were introduced for removing hard tissues for early interventions and less invasive procedures. Later hydrokinetic system (San Clemente, CA; Nd:YAG lasers, American Dental technology, Southfield, MI; Ceralas D diode laser, East Longmeadow, Biolase) were introduced for the removal of caries and tooth preparations utilizing laser energy [10]. Those evolutionary developments in restorative dentistry have resulted in the uprising of new concepts for cutting dental tissues and modifications of existing tooth designs without any invasive interventions.
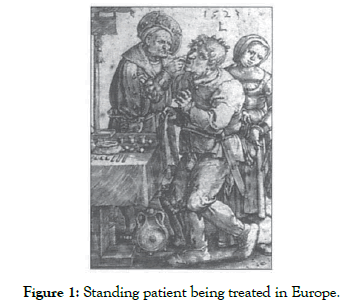
Figure 1: Standing patient being treated in Europe.
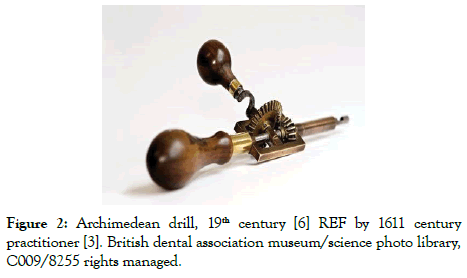
Figure 2: Archimedean drill, 19th century [6] REF by 1611 century practitioner [3]. British dental association museum/science photo library, C009/8255 rights managed.
Different kinds of burs are now used depending on the type of cutting and procedure. Modern dental burs have the capability of cutting the tissue much faster. Different kind of dental burs are used with the air-driven handpiece for cutting dental hard tissue. The dental handpiece can rotate the bur at the speed of 400,000- 500,000 rpm. Dental bur can cut the tissue much faster therefore, requires careful assessment to ensure no damage is caused to the healthy dental tissue. Figure 3 shows a different kind of bur used in dental practice [11].
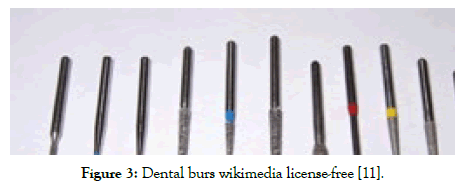
Figure 3: Dental burs wikimedia license-free [11].
State of the art hard tissue erbium lasers
In recent years the use of laser has achieved tremendous importance in the field of dentistry. Many wavelengths are approved by the US Food and Drug Administration (FDA) for the use of laser in the oral tooth [12]. Erbium lasers were granted approval by the Food and Drug Administration (FDA) for the hard tissue ablation. Two wavelengths have been developed for use clinically in dental practice. They are 1) Er: YAG laser having the wavelength of 2940 nm and 2) Er, Cr: YSGG laser having a wavelength of 2780 nm [13]. They are considered as the best of mid-infra-red lasers with the highest absorption affinity for water and hydroxy appetites [14]. Er: YAG has the highest penetration depth compared to Er, Cr: YSGG [15]. Both Er, Cr: YSGG and Er: YAG lasers have limited pulse durations, Er, Cr: YSGG has a limited pulse duration above 400 μs because of slower relaxation time of Er-Cr. Whereas Er: YAG has the capability of operating under 100 μs [16]. Recently Er: YAG and Er, Cr: YSGG were compared for their ablation efficiency using triangulation method [17,18]. Er: YAG laser showed greater ablation efficiency in enamel whereas the ablation efficiency in dentine was reduced. Different wavelengths and pulse durations were attributed to this difference. Many studies were conducted to evaluate the surface morphology of laser-treated teeth. Smear layer is the most important factor influencing the retention of the dental restorations. Er: YAG and Er, Cr: YSGG produces a popping sound during the ablation mechanism. This sound however, is less pronounced when ablating a healthy tissue and is louder when ablating a carious lesion because of its higher water content. This helps dentists to remove the diseased part of the tooth selectively while preserving healthy dental tissue.
Microleakage is a primary concern
As an introduction to this study, it is important to review the adverse effects of microleakage on the restored teeth. The ingress of acids, ions, enzymes and their products through gaps between tooth and restoration interface has been termed microleakage (Kidd EAM) [19]. This phenomenon may predispose a tooth to discoloration at tooth margins, recurrent decay and pulpal inflammation [20,21]. This leakage may not be visible clinically, but it has a major impact on the longevity of the restoration. The investigation of microleakage is, therefore important in the assessment of retention of restorative materials. Many factors influence microleakage. In 1989, polymerization shrinkage has been reported by Rees JS, Jacobson PH Mater, where the hardening phase causes a considerable contraction in volume, creating stresses and gaps between tooth walls and restoration [21]. Mechanical loading and thermal change cause elastic deformation and physical alteration of both tooth substances and restoration resulting in microleakage [22-24]. The composite material is highly technique sensitive. Moisture has a dramatic effect on the bond strength of the restoration to the tooth. Sealing ability of the restoration is markedly affected by the presence of moisture, non-incremental placement and inadequate light-curing time. A variety of in-vitro methods have been introduced to determine the microleakage that includes compressed air, neutron activation, electrochemical, fluid filtration bacteria and the use of dye [25-27]. Besides, various techniques such as scanning electron microscopy been used to image and measure the leakage. In the past, many year's researchers tried to investigate microleakage three-dimensionally [28-31]. However, this methodology was not recommended. The most effective method of evaluating microleakage was proposed by Taylor and Lynch [24], that involves the use of dye agents which can penetrate the tooth, stain it restoration and later assessed with a light microscope. This method involves immersion of samples in dye solution for a pre-set time, after which the tooth-restoration interface is examined for stain. This staining layer is contrasted in colour to both tooth structure and restoration. Different kind of dye agents were proposed by Taylor and Lynch in 1992 [23]. Those were: 0.5% basic fuchsin dye, 2% methylene blue, 50% silver nitrate solution [24]. For this study, 0.5% of fuchsin dye was used to evaluate microleakage.
Cerec cad-cam technology
CEREC (Chairside Economical Restoration of Esthetic Ceramics or Ceramic Reconstruction) is a dental restoration product that allows a dental practitioner to produce an indirect ceramic dental restoration using a variety of computer-assisted technologies, including 3D photography and Cad-Cam [32]. With CEREC, teeth can be restored in a single appointment with the patient, rather than the multiple sittings required with earlier techniques. Additionally, with the latest software and hardware updates, crowns, veneers, onlays and inlays can be prepared, using different types of ceramic material. CEREC AC is connected with the CEREC Software version 4.0 represents the latest advancement in the chair-side digital impression. CEREC AC Connect provides digital impressions of the highest precision for impeccable results [33]. Figure 4 shows a CEREC Cad-Cam machine from Sirona [34]. Anti-reflective spray (Figure 5) is required to take the digital impression of the tooth [35].
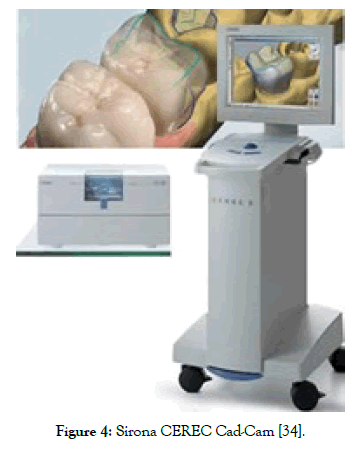
Figure 4: Sirona CEREC Cad-Cam [34].
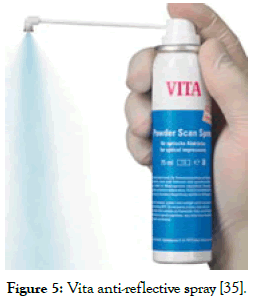
Figure 5: Vita anti-reflective spray [35].
Thermocycle
Thermo cycling is a widely accepted method used in vitro microleakage studies to evaluate microleakage. This involves subjecting the specimen to a moist, hot and cold environment. Many studies were conducted to evaluate microleakage using a thermocycling procedure [36-40]. In this method of thermocycling, specimens are subjected to thermal conditions similar to the intraoral environment. However, the literature shows that there is a wide range in temperature extremes and transfer times between baths and dwell times [40-42]. Therefore, there is no standard method for thermocycling in microleakage studies, and this permits contradictory discussions and results in various laboratory studies. In some studies, the variables chosen for thermocycling were only restricted to the method of thermocycling and are not intended to understand the meaning of these effects [43]. Because of this, in the present studies, the temperature of the thermocycler bath (Figure 6) is standardized at 5ºC-55ºC and the dwell time is set to 30 seconds. These variables seem to be tolerated by the oral tissues and are suitable for clinical conditions. Increases in the dwell times exceed real clinical conditions and may affect the thermal isolation of composite materials [44].
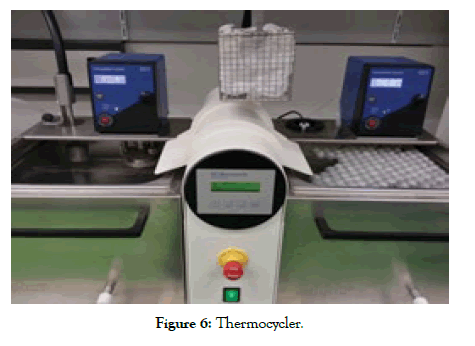
Figure 6: Thermocycler.
Aim of the study
Aim of the study is to investigate if the cavities prepared with modern Hard tissue lasers Er: YAG and Er, Cr: YSGG are comparable to handpiece bur in terms of surface quality. Incipient caries under the restoration and lack of retention are the two major problems we face in our everyday practice. After preparation with laser and conventional bur system, the cavities were restored with Cerec cadcam and composite filling materials and evaluated for microleakage using four-point qualitative scale [45].
Material and Methods
Sample selection
53 bovine incisor teeth were selected for this study (Figure 7). They were all freshly extracted from the bovine animal immediately after slaughtering. All the samples were carefully examined, cleaned with a scalpel blade and dipped into the tonic solution until utilization.
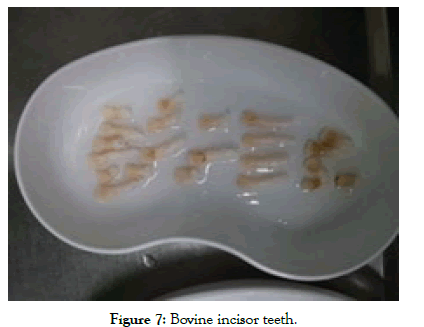
Figure 7: Bovine incisor teeth.
Preparation of samples
Samples were divided into 3 groups. Group 1 and group 2 were subjected to be irradiated with lasers and group 3 samples were to be treated with a conventional bur. Samples were fixed onto the putty clay as shown in Figure 8. Mask was positioned onto the tooth surface (Figure 9). This mask had a 3 mm diameter hole which was administered a guide to form a 3.0 mm diameter tooth. On each tooth, maximum of 4 cavities were prepared.
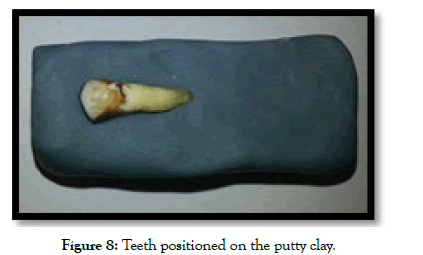
Figure 8: Teeth positioned on the putty clay.
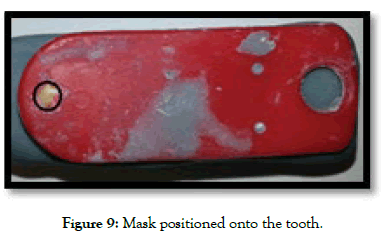
Figure 9: Mask positioned onto the tooth.
Fotona dental laser (Erbium YAG)
The Er: YAG laser used in this study was a Fotona light walker with H14 tip, non-contact mode with the tip diameter of 1.3 mm. Fotona has revolutionized dentistry with treatments that are faster, more effective than ever before. With over 45 years of experience in laser technology, Fotona’s award-winning Light Walker dental laser systems are leading the dental industry forward to new levels of perfection with precision, performance and ease of use (Figure 10). Fotona was the first manufacturer to introduce two complementary laser wavelengths (Er: YAG and Nd: YAG) in a single system (Twinlight, 1994) and the first to develop a dental laser that outperforms a conventional rotary drill (Fidelis Plus II, 2004) [46].
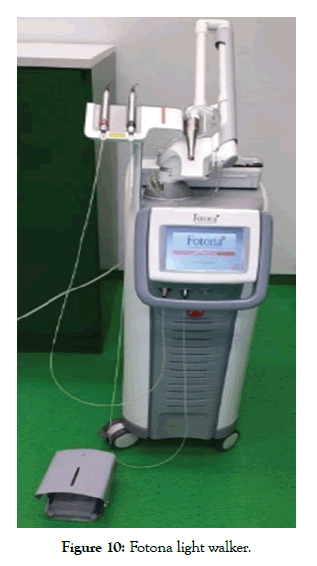
Figure 10: Fotona light walker.
Teeth were held onto the putty clay. Mask was fixed onto the tooth surface as a guide to prepare a 3 mm diameter tooth. Fotona H14 with the tip diameter of 1.3 mm (Figure 11) and the length of 8 mm was used in non-contact mode. Er;YAG (Fotona light walker) having a wavelength of 2940 nm, energy per pulse of 10W, and the repetition rate of 20 Hz, yielding an energy density of 37.669 J/cm2. A circular pattern was followed along with the mask until a certain depth was attained. After the preparation, samples were carefully examined and were placed in a tonic solution until further steps were followed.

Figure 11: H14 fotona tip.
iPlus Waterlase (erbium chrome YSGG)
The Er, Cr: YSGG laser used in this study was iPlus Waterlase from Biolase MD fitted with a Gold handpiece and the tip diameter of 600 μm. iPlus Waterlase MD (Figure 12), is the advanced laser technology incorporated by Biolase in California, that combines the laser energy and water called a Hydrophotanic process [46]. Figure 9 shows the iPlus Waterlase laser device from Biolase. This laser has the highest absorption in water and hydroxyapatites. MZ6 tip is used with Waterlase (Figure 13). This tip is 6 mm long and has the tip diameter of 600 μm.
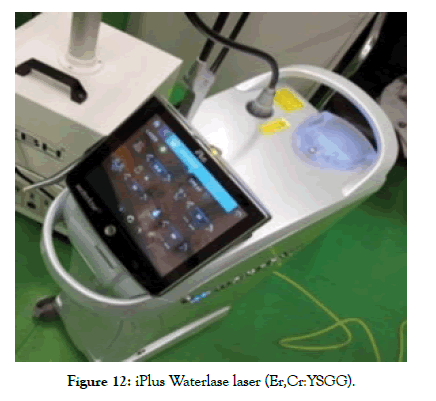
Figure 12: iPlus Waterlase laser (Er,Cr:YSGG).
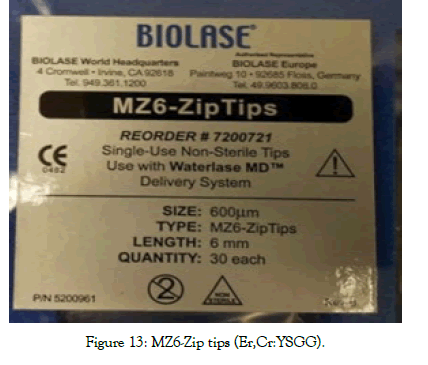
Figure 13: MZ6-Zip tips (Er,Cr:YSGG).
Teeth were held onto the putty clay. Mask was fixed onto the tooth surface as a guide to prepare a 3 mm diameter tooth. MZ6 Zip Tip with the diameter of 600 μm and the length of 6 mm was used in the non-contact mode. Hard tissue mode was selected with the pulse duration of 50 μs, energy per pulse of 10 W, and the repetition rate of 20 Hz, yielding an energy density of 176.83 J/cm2. A circular pattern was followed along with the mask until a certain depth was achieved. After the preparation, samples were carefully examined and placed in the tonic solution until further steps.
Overview of laser settings
The overview of laser settings shown in Table 1.
| Value | Fotona H14 (Er: YAG) | iPlus Waterlase (Er, Cr: YSGG) |
|---|---|---|
| Mode | MSP 100 µs | H–mode 50 µs |
| Pulse energy | 500 mJ (10 W) | 500 mJ (10 W) |
| Repetition rate | 20 Hz | 20 Hz |
| Water: Air | 5:09 | 80:50:00 |
| Length of tip | 8 mm | 6 mm |
| Diameter of tip | 1.3 mm | 600 µm |
Table 1: Overview of laser settings.
Control handpiece bur preparation
Handpiece drill (Figure 14) is the convention state of the art that is used in every day clinical work for different procedures on hard and soft tissue. The handpiece is air driven that has water spray included avoiding frictional heat. The air from the compressor forcefully rotates the bur at the speed of 400,000 rpm fast enough to remove the dental tissue in seconds. Different kind of burs can be used depending on the purpose. We used cylindrical bur to prepare the cavities (Figure 15). Circular pattern was followed until the desired depth is achieved and the time was noted. After the preparation, samples were carefully examined and stored in the tonic solution until utilization.

Figure 14: Handpiece (super torque).

Figure 15: Cylindrical bur.
Restoration of the cavities with cerec-cad-cam restorations
Selected samples were prepared for CEREC Cad-Cam fillings (Figure 16) [47]. Samples were cleaned with water sprayed to remove any debris and dried carefully. Samples were fixed onto the putty clay. Each sample was sprayed with an anti-reflective (Figure 17) [48] from VITA Zahnfabrik H. Rauter GmbH and Co. KG. This spray is a blue pigmented spray required to create an impression onto the Cad-Cam. Optical impression was taken using an infrared scanner handpiece wired to the computer. This allows the three- dimensional software to design the restoration according to the required specifications. Cerec Vita block i10 was used in this study. After designing, the data was sent to the milling machine. It was difficult by a milling machine to craft a small 3.0 mm tooth from one cerec block. That’s why all the cavities on a single tooth were crafted from single cerec block (Figures 18 and 19).
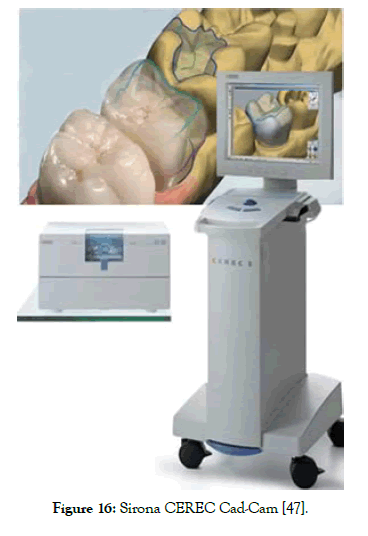
Figure 16: Sirona CEREC Cad-Cam [47].
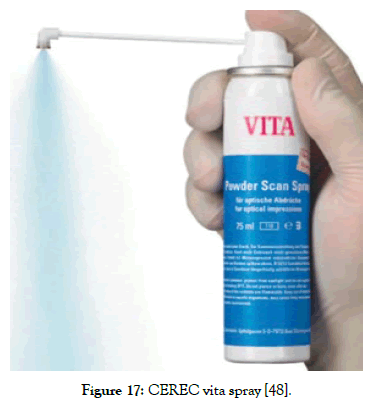
Figure 17: CEREC vita spray [48].
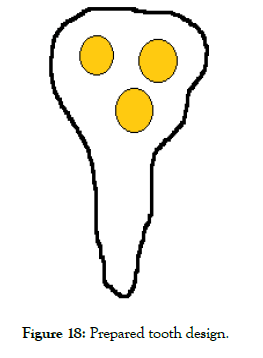
Figure 18: Prepared tooth design.
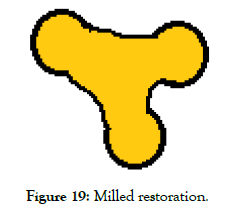
Figure 19: Milled restoration.
The Cerec Cad-Cam is the new modern chairside multi-task technology to fabricate dental prosthetics. It is cost-effective and does not require the sending of the impressions to the specified dental laboratory for fabrication.
Cavities were prepared for final restoration using CEREC Cad- Cam technology. Selected cavities from each group were cleaned with an alcohol solution to remove the anti-reflective coating. Ceramic inlay was treated with hydrofluoric acid according to manufacturing guideline. iBond self-etchant from Heraeus Kulzer GmbH, Germany (Figure 20) was used to etch the ceramic inlay restorations. After the etching, the samples were rinsed with water and dried. Syntac primer adhesive was applied onto the surface of the inlay (Figure 21). The inlay restoration was gently dried until the solvent has completely evaporated. Cavities were etched with iBond etchant from Heraeus Kulzer GmbH (Figure 20). Cavities were rinsed and dried according to manufacturer instructions. Tooth surface was coated with a thin layer of bonding resin from Helibond Ivoclar Vivadent (Figure 22). Variolink II from Ivoclar Vivadent (Figure 23) was used to cement the ceramic restoration into the prepared tooth. Variolink II is two pastes dual-cured lightcured luting cement. It has a catalyst paste and Base paste which is mixed together with equal concentration and cemented. Equal concentration of the catalyst and base paste was mixed. This paste was applied to the tooth to be restored. Ceramic inlay was cemented into the prepared tooth. Excess cement was removed using sponges and light cured. The surface of the restoration was polished with a polishing bur.
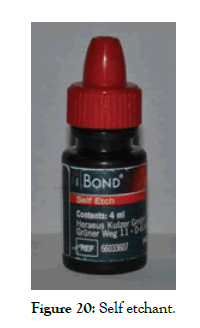
Figure 20: Self etchant.
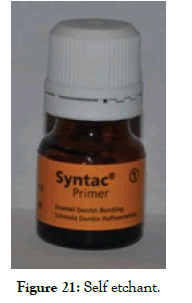
Figure 21: Self etchant.
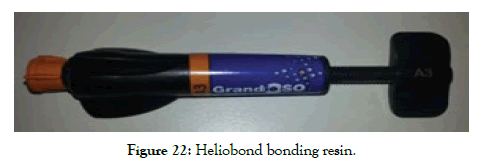
Figure 22: Heliobond bonding resin.
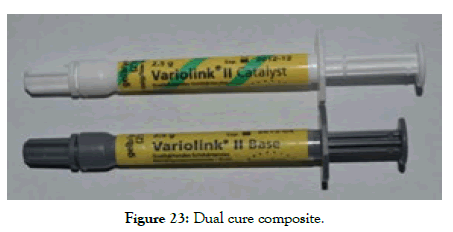
Figure 23: Dual cure composite.
Restoration of cavities with nano-composite
Remaining samples from each treated group were filled with nano composite. Samples were cleaned with normal saline and dried. Prepared cavities were etched with 35% phosphoric acid etchant for 15 seconds (Figure 24). After 15 seconds the cavities were thoroughly washed with water for 10 seconds. Cavities were then air-dried for 5 seconds. After this procedure, the etched surface was coated with a thin layer of bonding resin (Figure 22) and lightcured for 20 seconds. Cavities were then filled with nano-composite filling material (Figure 25) with an increment of 2 mm and lightcured. After the final curing with light for 45 seconds, the cavities were polished with a polishing bur.
Figure 24: 35% phosphoric acid etchant.

Figure 25: Voco Grandioso nano-composite.
Sealing of root apex with nano-composite restoration
To conduct the test for microleakage using thermocycling and dye penetration procedure, it is necessary to close the root apex of the tooth using conventional nano-composite filling material (Figure 26). The apical opening of the tooth was etched, bonded with resin and restored with light cure nano-composite restoration to avoid ingress of dye solution.
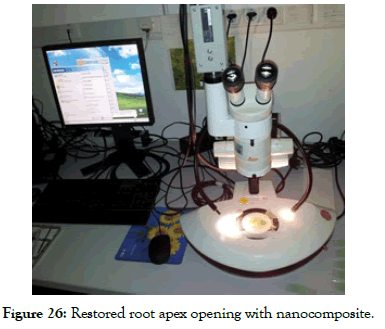
Figure 26: Restored root apex opening with nanocomposite.
Investigating Tools
Analyzing tooth morphology
Samples were examined under Leica MZ6 stereomicroscope after the dye penetration test to assess the microleakage of the restored tooth. The Leica MZ6 (Figure 27) is a modular stereomicroscope with 6.3:1 zoom power. Leica light microscope is used to investigate the tooth morphology. This light microscope combines high-quality Leica optics with state-of-the-art yellow light LED illumination. The Leica MZ6 flexible upright microscope system uses LED illumination for all contrast methods: Bright Field (BF), Darkfield (DF), Differential Interference Contrast (DIC), Qualitative Polarization (POL), and Fluorescence (FLUO) applications [49]. Leica is a well-known imaging digital microscope among others with the best possible imagining without distortion the image is captured on the computer software named DISCUS.
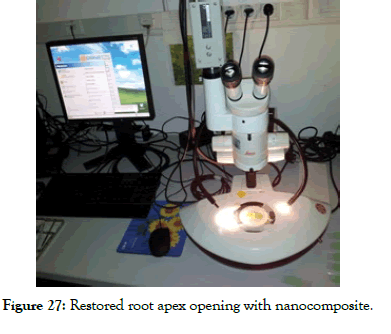
Figure 27: Restored root apex opening with nanocomposite.
Electron microscopic imaging
Samples from each group were examined under electron microscopic to assess the surface quality of the cavities prepared with Erbium lasers and conventional bur handpiece.
Sectioning of samples: Samples were sectioned by a sharp band saw from EXAKT (Figure 28). This sharp blade gives a precise and accurate cutting surface (Figure 29). Horizontal sectioning was carried out on all selected teeth (Figure 30).
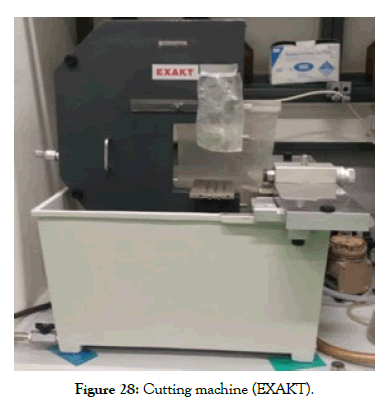
Figure 28: Cutting machine (EXAKT).
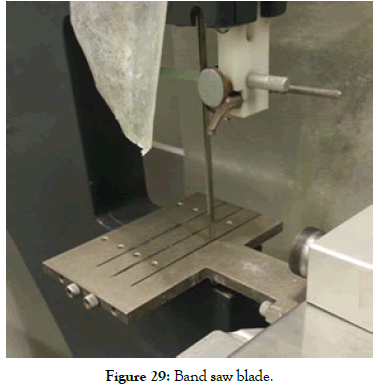
Figure 29: Band saw blade.
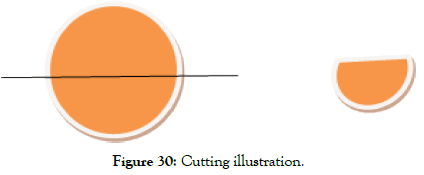
Figure 30: Cutting illustration.
Drying of samples with solvents: The samples must be completely dried before preparing for SEM imaging (Figure 31). Dirt or oil and moisture must be removed with the available solvents without altering the morphology of specimens. Samples were placed in sodium chloride NaCl for 4 hr. After 4 hr. samples were placed in aqueous distilled water for a period of 1 hr. This step was repeated for 1 hr. After this, the samples were placed in a 50% ig ethanol solution for 1 hr. This step was repeated 2 times. After this, the samples were placed in 70% ig ethanol for 1 hr. This step was repeated twice as well. After this step, the samples were placed in 96% ig ethanol for 1 hr. This step was repeated 2 times. After that, the samples were placed in 100% ethanol for 1 hr. This final step was repeated 3 times. These steps will completely dehydrate the samples (Table 2). It is a standard process to dry the samples at microscopic level.
| Solution % | Duration |
|---|---|
| NaCl | - |
| Sodium Chloride | 1 × 4 hr. |
| Aqueous distilled water | 2 × 1hr. |
| Ethanol 50% | 2 × 1hr. |
| Ethanol 70% | 2 × 1hr. |
| Ethanol 96% | 2 × 1hr. |
| Ethanol 100% | 3 × 1hr. |
Table 2: SEM protocol.
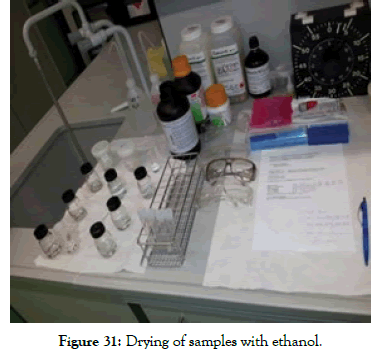
Figure 31: Drying of samples with ethanol.
Drying of samples in an incubator: Samples were dried overnight in an incubator (Figure 32). This incubator is from Heraeus B5050 with natural convection and glass inner door. The temperature of the incubator was maintained to 37°C. This is equivalent to the temperature in the oral tooth.
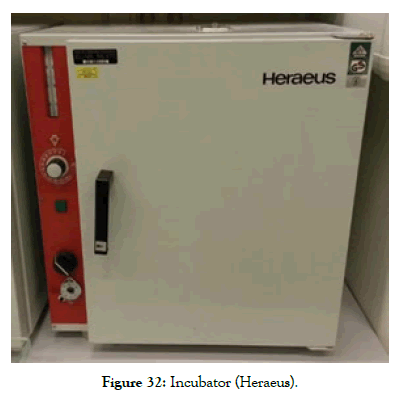
Figure 32: Incubator (Heraeus).
Fixing samples on samples holder/stubs: Samples were held in place onto the SEM holder/stubs using an adhesive (Figure 33). Extra care was taken to keep the samples free from any contaminants.
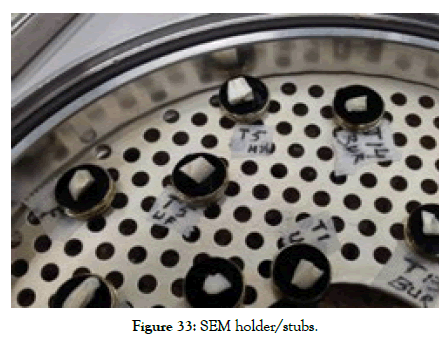
Figure 33: SEM holder/stubs.
Each sample was labelled and processed further in the gold alloy machine.
Sealing the samples in a vacuum reservoir: Sample holder/stubs were placed into the vacuum reservoir (Figure 34) and sealed. This will protect the samples from environmental contaminants and moisture.
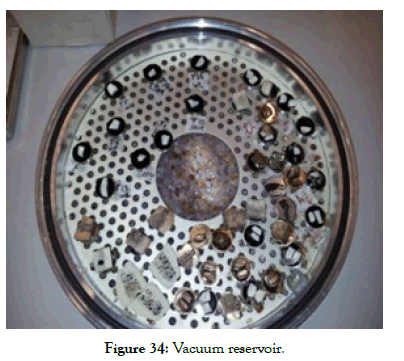
Figure 34: Vacuum reservoir.
Coating of samples with thin gold layer: Samples were sprayed with a thin layer of gold alloy in the gold alloy machine (Figures 35 and 36). When samples are bombarded by the electron beam in an Scanning Electron Microscope (SEM), the electrons have no place to go and may cause problems in the imaging because of their insulating properties. Further, the electron beam may damage the sample. These problems are eliminated by coating the specimen with a thin layer of metal, such as gold, or a 60/40 gold/palladium alloy (as used by the BBPIC). The layer deposited is typically 10 nm to 20 nm, and nearly evenly coats the surface of the specimen [50]. The gold alloy was used to coat the sample surface. Figure 37 shows the gold coating machine we used in this study. It has a container in which all the samples to be treated are placed with the sample holder/stubs.
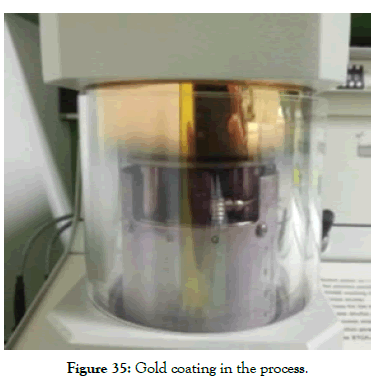
Figure 35: Gold coating in the process.
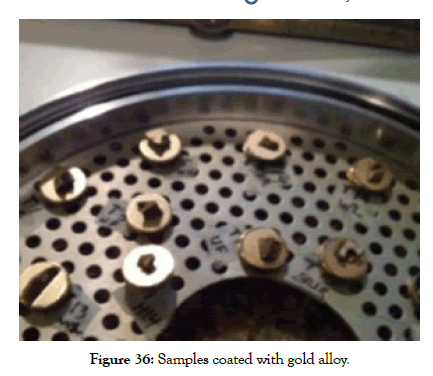
Figure 36: Samples coated with gold alloy.
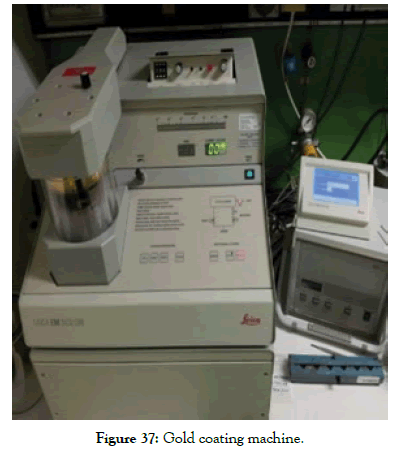
Figure 37: Gold coating machine.
SEM imaging: SEM imaging was carried out in an SEM department (Figure 38). Samples were imaged from different angles and different magnifications to understand the surface quality of the treated cavities. The image was recorded for further analysis.
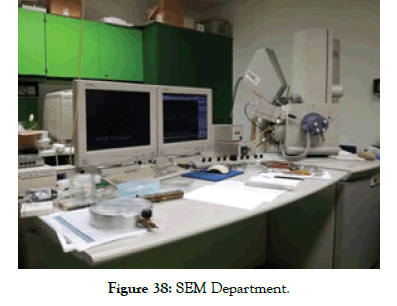
Figure 38: SEM Department.
Thermocycling: The specimens were subjected to a thermal cycling regimen of 10,000 cycles between 5°C and 55°C temperature. SD Mechatronik thermocycler was used to thermocycler all restored samples (Figure 39). This thermocycler is equipped with 2 baths system. One bath contains hot water with a temperature of 55°C and the second bath contains cold water with 5°C and the temperature was maintained. This took 8 days to complete 10,000 cycles (Figure 40).
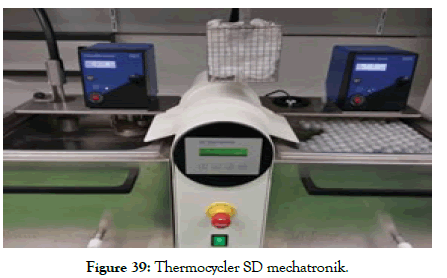
Figure 39: Thermocycler SD mechatronik.
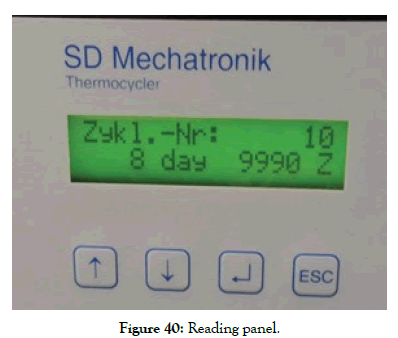
Figure 40: Reading panel.
Dye penetration test: After the thermocycling procedure, samples were prepared for microleakage test using 0.5% fuchsin dye. Samples were coated with nail varnish (Figure 41) leaving 1 mm uncoated around the restoration margins. Samples were immersed in 0.5% fuchsin dye for 24 hrs. After 24 hrs samples were thoroughly cleaned with water. Nail polish varnish was removed using a nail polish remover (Figure 42).
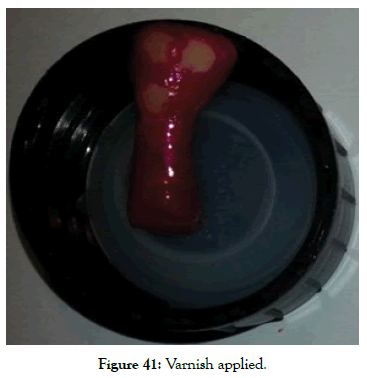
Figure 41: Varnish applied.
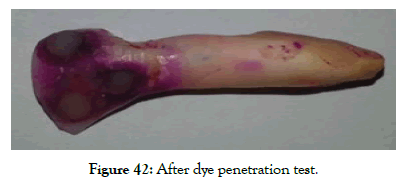
Figure 42: After dye penetration test.
Cutting of samples to evaluate microleakage: All samples were sectioned by a sharp band saw machine from EXAKT (Figure 43). The dyed samples were sectioned and examined under a Leica MZ6 stereo microscope for microleakage scoring. Microleakage was scored using a four-point qualitative scale [50].
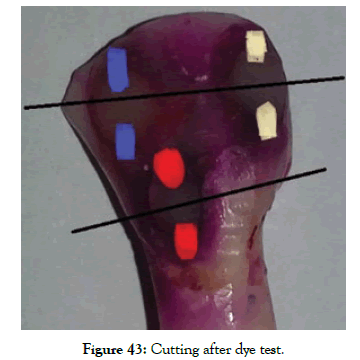
Figure 43: Cutting after dye test.
Results and Calculations
SEM results
Fotona light walker H14 (Er: YAG): Electron microscopic imaging of the sample surface treated with Er: YAG showed minor surface irregularities. The surface of the prepared tooth was free from smear layer and debris, leaving the dentinal tubules wide open (Figure 44).
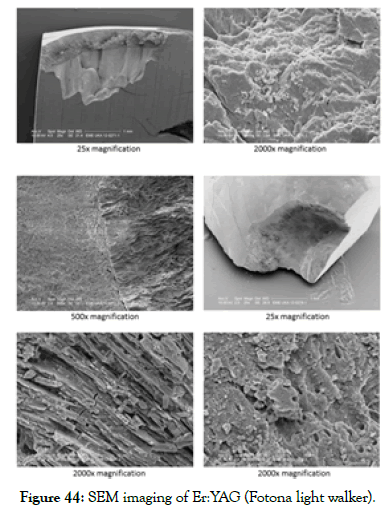
Figure 44: SEM imaging of Er:YAG (Fotona light walker).
iPlus Waterlase (Er, Cr: YSGG): SEM imaging of the cavities treated with iPlus Waterlase device with MZ6 tip showed a clean texture with minor surface irregularities. Tooth surface was free from debris and smear layer leaving the dentinal tubules open (Figure 45).
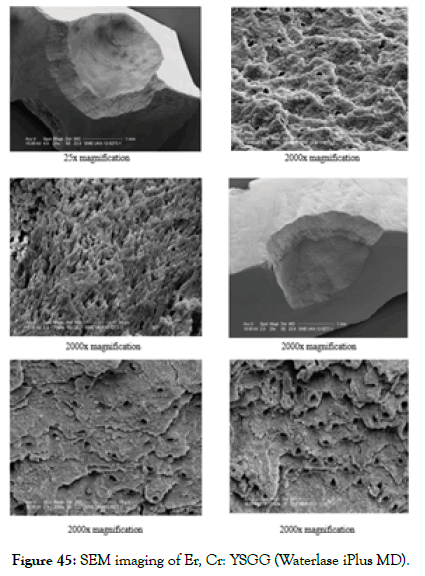
Figure 45: SEM imaging of Er, Cr: YSGG (Waterlase iPlus MD).
Conventional handpiece bur: Tooth treated with conventional handpiece bur showed accumulation of debris and smear layer. No surface irregularities were seen on the surface of the tooth. Dentinal tubules were not visible in SEM imagine because of the smear layer and debris (Figure 46).
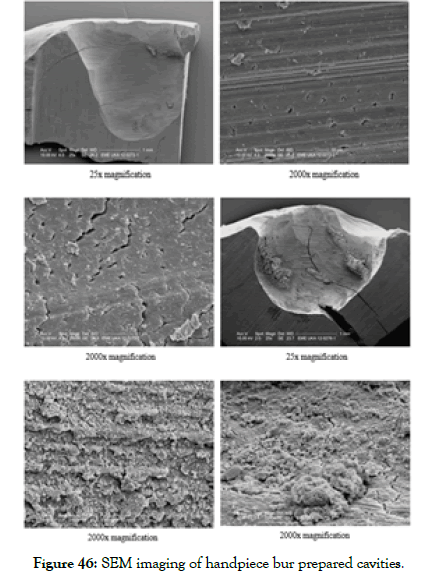
Figure 46: SEM imaging of handpiece bur prepared cavities.
Nano composite restorations
Fotona light walker H14 (Er: YAG): All the nano-composite restored cavities were examined under a Leica stereomicroscope to evaluate the extent of dye penetration (Figure 47).
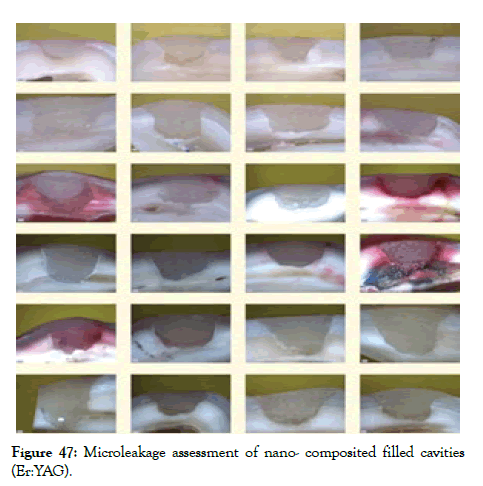
Figure 47: Microleakage assessment of nano- composited filled cavities (Er:YAG).
iPlus Waterlase (Er, Cr: YSGG): All the nano-composite restored cavities were examined under a Leica microscope to evaluate the extent of dye penetration (Figure 48).
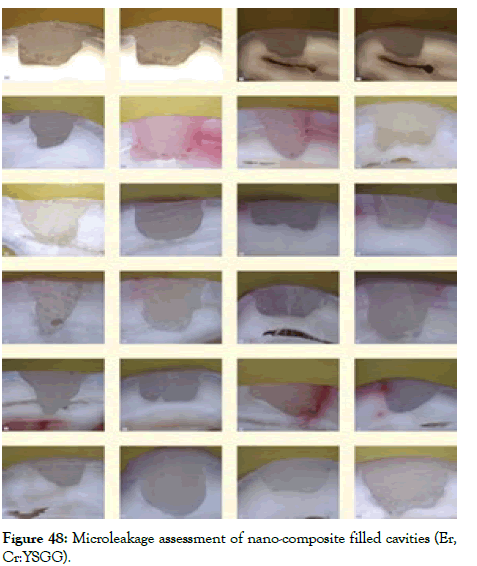
Figure 48: Microleakage assessment of nano-composite filled cavities (Er,Cr:YSGG).
Conventional handpiece bur: All the nano-composite restored cavities were examined under a Leica microscope to evaluate the extent of dye penetration (Figure 49).
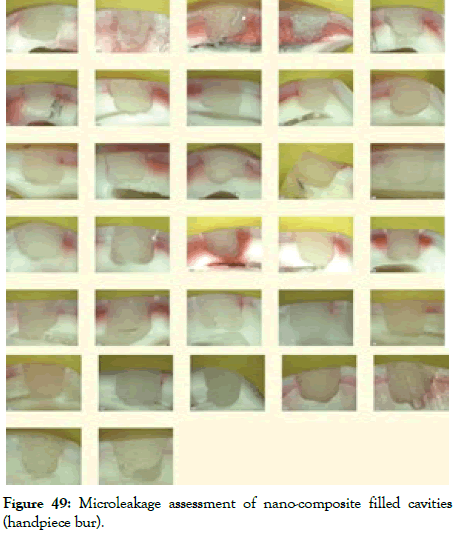
Figure 49: Microleakage assessment of nano-composite filled cavities (handpiece bur).
Microleakage scoring
Nano-composite filled cavities: Samples were carefully examined under a Leica MZ6 stereomicroscope and scored using a four-point qualitative scale (Table 3) [51]. Samples were scored for microleakage (Tables 4 and 5).
| Score | Content |
|---|---|
| 0 | No penetration |
| 1 | Dye penetration along with the enamel interface |
| 2 | Dye penetration along with the dentin interface but not reaching the pulpal floor of the tooth |
Table 3: Microleakage qualitative scale ISO WP 114905 1998-06-04 [51].
| Devices | 0 | 1 | 2 | 3 |
|---|---|---|---|---|
| Fotoma H14 Er: YAG | 17 | 2 | 3 | 3 |
| iPlus Er, Cr: YSGG | 16 | 3 | 5 | 0 |
| Handpiece bar | 5 | 6 | 16 | 1 |
Table 4: Microleakage scoring of nano-composite filled cavities.
| Groups | No penetration % | Enamel % | Dentin % | Pulpul floor of the cavity % | Total cavities |
|---|---|---|---|---|---|
| Fotoma H14 Er: YAG | 68 | 8 | 12 | 12 | 25 |
| iPlus Er, Cr: YSGG | 66.6 | 12.5 | 20.8 | - | 24 |
| Handpiece bar | 17.8 | 21.4 | 57.1 | 3.5 | 28 |
Table 5: % Microleakage (nano-composite filled cavities).
CEREC Cad-Cam restoration
iPlus Waterlase MD (Er, Cr: YSGG): Samples were carefully examined under Leica MZ6 stereomicroscope and scored for microleakage (Figure 50).
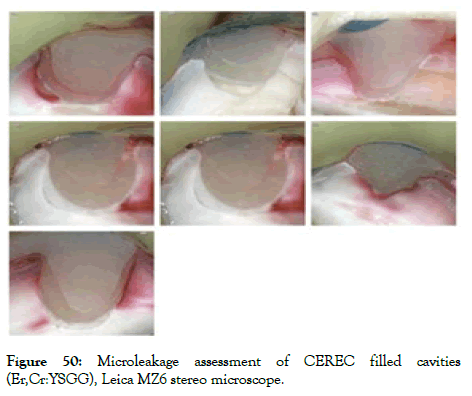
Figure 50: Microleakage assessment of CEREC filled cavities (Er,Cr:YSGG), Leica MZ6 stereo microscope.
Fotona light walker H14 (Er: YAG): Samples were carefully examined under Leica MZ6 stereomicroscope and scored for microleakage (Figure 51).
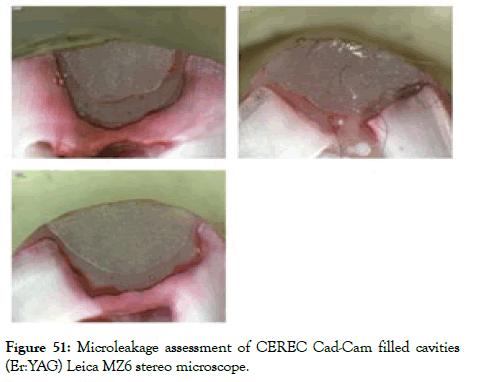
Figure 51: Microleakage assessment of CEREC Cad-Cam filled cavities (Er:YAG) Leica MZ6 stereo microscope.
Conventional handpiece bur: Samples were carefully examined under a Leica light microscope and scored for microleakage (Figure 52).
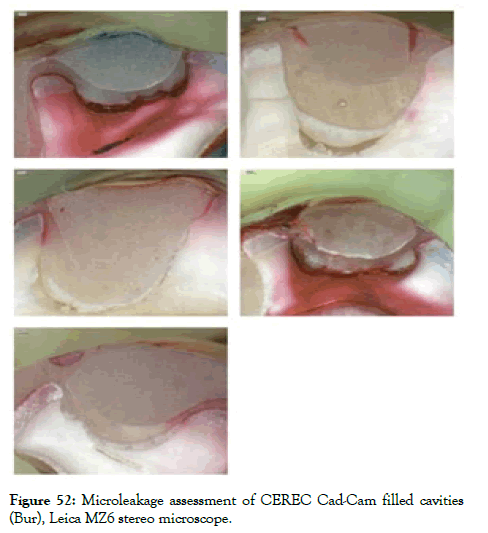
Figure 52: Microleakage assessment of CEREC Cad-Cam filled cavities (Bur), Leica MZ6 stereo microscope.
Microleakage scoring
CEREC Cad-Cam filled cavities: The dye penetration was scored using a four-point qualitative scale (Table 6) [51]. Samples were scored for microleakage (Tables 7 and 8).
| Score | Content |
|---|---|
| 0 | No penetration |
| 1 | Dye penetration along with the enamel interface |
| 2 | Dye penetration along with the dentin interface but not reaching the pulpal floor of the tooth |
Table 6: Microleakage qualitative scale ISO WP 114905 1998-06-04 [51].
| Devices | 0 | 1 | 2 | 3 |
|---|---|---|---|---|
| Fotoma Er:YAG | - | - | - | 3 |
iPlus Er, Cr: YSGG |
1 | 2 | 2 | 1 |
| Handpiece bar | 2 | - | 1 | 3 |
Table 7: Microleakage scoring.
| Groups | No penetration % | Enamel penetration % | Dentin penetration % | Pulpul penetration % | Total cavities |
|---|---|---|---|---|---|
| Er: YAG | - | - | - | 100 | 3 |
| Er, Cr: YSGG | 16.66 | 33.33 | 33.33 | 16.66 | 6 |
| Handpiece | 33.33 | - | 16.66 | 50 | 6 |
Table 8: % Microleakage scoring (CEREC Cad-Cam).
Statistical Analysis
Statistical analysis (Microleakage)
Nano-composite filled cavities: Kruskal-Wallis test, Dunn’s test, Mann-Whitney test was performed. The statistic test indicated a significant difference among laser prepared cavities and bur prepared cavities (p<0.05) with the confidence interval of 95% (Tables 8-12). Although Er: YAG laser showed less microleakage compared to Er, Cr: YSGG and control bur. Highest microleakage was observed with handpiece bur prepared cavities. From this comparison, it is evedent that both Er: YAG and Er, Cr: YSGG laser prepared cavities has a strong interlock between bond material and dentinal tubules because of the absence of debris and the smear layer, which is highly evident in bur treated group.
When comparing Er: YAG with control bur, Er, Cr: YSGG with control bur and Er, Cr: YSGG with Er: YAG using Mann-Whitney test, regardless of the leakage is in enamel, dentine or floor of the pulp, a significant difference is observed between Laser Groups and Control bur. Non-significant results were observed while comparing Er: YAG and Er, Cr: YSGG.
Repeated measures one-way ANOVA test
Kruskal-Wallis test: Kruskal-Wallis test (Microleakage comparison of nano-composite filled cavities) shown in Table 9.
| Kruskal-Wallis test | - |
|---|---|
| p value | 0.0012 |
| Exact or approximate p value | Gaussian approximation |
| p value summary | - |
| Do the medians vary significant (p<0.05) | Yes |
| Number of groups | 3 |
| Kruskal-Wallis statistic | 13.42 |
Table 9: Kruskal-Wallis test (Microleakage comparison of nano-composite filled cavities).
Dunn’s multiple comparison test: Dunn’s multiple comparison tests (nano-composite filled cavities) shown in Table 10.
| Dunn’s multiple comparison test | Difference in rank sum | Significant? p<0.05? | Summary |
|---|---|---|---|
| Er: YAG vs Er, Cr: YSGG | 1.857 | No | ns |
| Er: YAG vs control bur | -16.88 | Yes | - |
| Er, Cr: YSGG vs control bur | -18.74 | Yes | - |
Table 10: Dunn’s multiple comparison tests (nano-composite filled cavities).
Columns analysis: Column analysis (Microleakage comparison of nanocomposite filled cavities) shown in Table 11.
| Number of values | Er: YAG 25 | Er, Cr: YSGG 24 | Handpiece bur 28 |
|---|---|---|---|
| Minimum | 0 | 0 | 0 |
| 25% | 0 | 0 | 1 |
| Median | 0 | 0 | 2 |
| 75% | 1.5 | 1 | 2 |
| Maximum | 3 | 2 | 2 |
| Mean | 0.68 | 0.5417 | 1.393 |
| Standard deviation | 1.108 | 0.833 | 0.786 |
| Standard error | 0.2215 | 0.17 | 0.1485 |
| Lower 95% CI | 0.2228 | 0.1899 | 1.088 |
| Upper 95% CI | 1.137 | 0.8934 | 1698 |
Table 11: Column analysis (Microleakage comparison of nanocomposite filled cavities).
Graph: The graph was plotted to compare the mean value of three groups (Graphs 1-5).
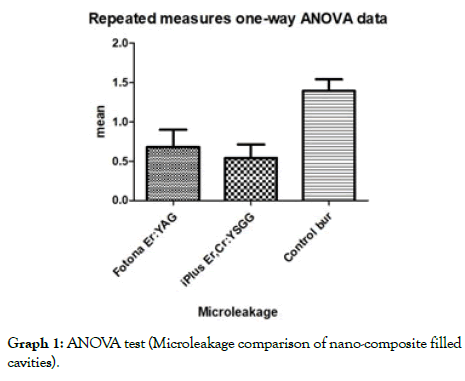
Graph 1: ANOVA test (Microleakage comparison of nano-composite filled cavities).
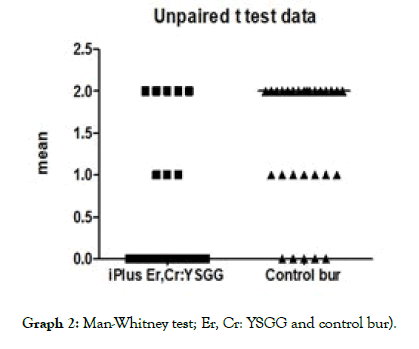
Graph 2: Man-Whitney test; Er, Cr: YSGG and control bur).
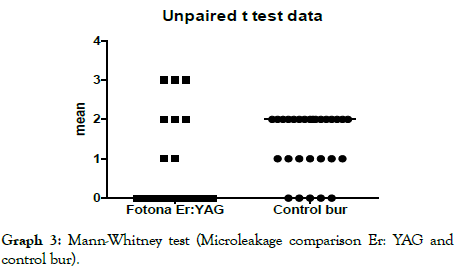
Graph 3: Mann-Whitney test (Microleakage comparison Er: YAG and control bur).
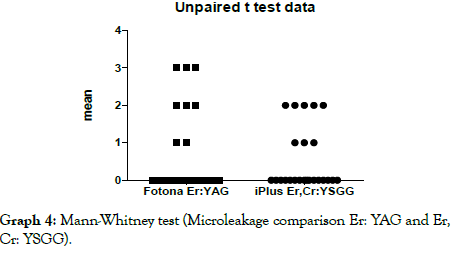
Graph 4: Mann-Whitney test (Microleakage comparison Er: YAG and Er,Cr: YSGG).
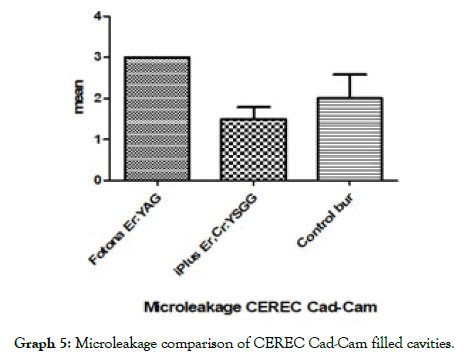
Graph 5: Microleakage comparison of CEREC Cad-Cam filled cavities.
Mann-Whitney test (Er, Cr: YSGG and conventional handpiece bur): Mann-Whitney test (Microleakage comparison of Er, Cr: YSGG and control bur) shown in Table 12.
| Table analyzed | Unpaired t-test data |
|---|---|
| Column A | iPlus Er, Cr: YSGG |
| vs | vs |
| Column B | Control bur |
| Mean whitney test | - |
| p-value | 0.0008 |
| Exact or approximate p-value? | Gaussian approximation |
| p-value summary | - |
| Are medians significant different? (p<0.05) | Yes |
| One- or two-tailed p value | Two-tailed |
| Sum of ranks in column A,B | 465.5, 912.5 |
| Mann-whitney U | 165.5 |
Table 12: Mann-Whitney test (Microleakage comparison of Er,Cr:YSGG and control bur).
Mann-Whitney test (Er: YAG and control bur): Mann-Whitney test (Microleakage comparison of Er: YAG and control bur) shown in Table 13.
| Table analyzed | Unpaired t-test data |
|---|---|
| Column A | Fotona Er: YAG |
| vs | vs |
| Column B | Control bur |
| Mean whitney test | - |
| p-value | 0.0055 |
| Exact or approximate p-value? | Gaussian approximation |
| p-value summary | - |
| Are medians significant different? (p<0.05) | Yes |
| One- or two-tailed p-value | Two-tailed |
| Sum of ranks in column A,B | 528.5, 902.5 |
| Mann-whitney U | 203.5 |
Table 13: Mann-Whitney test (Microleakage comparison of Er: YAG and control bur).
Mann-Whitney test (Er: YAG and Er, Cr: YSGG): Mann-Whitney test (Er: YAG and Er, Cr: YSGG) shown in Table 14.
| Table analyzed | Unpaired t-test data |
|---|---|
| Column A | Fotona Er: YAG |
| vs | vs |
| Column B | iPlus Er, Cr: YSGG |
| Mean whitney test | - |
| p value | 0.8661 |
| Exact or approximate p value? | Gaussian approximation |
| p value summary | No |
| Are medians significant different? (p<0.05) | No |
| One- or two-tailed p value | Two-tailed |
| Sum of ranks in column A,B | 632.5, 592.5 |
| Mann-whitney U | 292.5 |
Table 14: Mann–Whitney test (Er:YAG and Er,Cr:YSGG).
CEREC filled cavities: Kruskal-Wallis test and Dunn’s test were performed to compare the mean variances (Tables 15 and 16). The statistical analysis indicated non-significant results (p>0.05)
| Table analyzed | Data 1 |
|---|---|
| Kruskal-wallis test | - |
| p value | 0.2881 |
| Exact or approximate p value? | Gaussian approximation |
| p value summary | Non-significant |
| Do the medians very significant (p<0.05) | No |
| Number of groups | 3 |
| Kruskal-wallis statistic | 2.489 |
Table 15: Kruskal-Wallis test (Microleakage comparison of CEREC Cad-Cam restored cavities).
| Dunn’s multiple comparison test | Difference in rank sum | Significant? p<0.05? | Summary |
|---|---|---|---|
| Er: YAG vs Er, Cr: YSGG | 4 | No | ns |
| 2.667 | No | ns | |
| Er: YAG vs control bur | |||
| Er, Cr: YSGG vs control bur | -1.333 | No | ns |
Table 16: Dunn’s multiple comparison test (CEREC Cad-Cam restored cavities).
Discussion
Bovine teeth were selected for this study because of the unavailability of human teeth. In this study the surface quality of Er: YAG, Er, Cr: YSGG and conventional handpiece bur prepared cavities were examined and compared under an electron microscope. Cavities prepared by each method were subdivided into two groups. Group 1 restored with nano-composite, whereas the 2nd groups were restored with CEREC Cad-Cam (Mark II blocks from VITA). Thermocycling and die penetration test of all restored cavities was carried out to evaluate the microleakage scoring.
SEM comparison
Samples from each group were examined for their surface quality under an electron microscope. We found that although the handpiece bur was the fastest, the tooth surface was altered by the deposition of the smear layer and debris. It was observed that both laser groups were superior in term of the surface quality with no smear layer and debris on the ablated surface. Dentinal tubules were fairly opened in both laser-treated cavities. The absence of smear layer improves the bond strength of the filling materials.
Microleakage
Cavities prepared by each method were subdivided into two groups. Group 1 restored with nano-composite, while other groups were restored with CEREC Cad-Cam (Mark II blocks from VITA). These groups were tested for microleakage after thermocycling and dye penetration test. The restored samples were placed in a thermocycler for 8 days (10,000 cycles). After thermocycling procedure, samples were varnished with nail polish leaving 1mm around the restoration. Samples were immersed in 0.5% Fuchsin dye for 24 hrs. After 24 hrs, the samples were cleaned, the varnish was removed, and the samples were sectioned to evaluate microleakage. Microleakage was carefully scored.
In nano-composite restorations, the microleakage score by the laser groups was 50% less than the microleakage score by control handpiece bur (Graph 1). SEM observations of both laser groups showed the absence of smear layer and the formation of minor surface irregularities. Such surface quality enhances bond strength.
CEREC Cad-Cam (Mark II blocks from VITA) filled cavities showed non-significant results between all prepared groups (p>0.05). The microleakage scores in this group were higher than that of the nano-composite group (Graph 5). When the tooth margin is thin, the ceramic will fracture during the milling process. Standard guidelines are yet to be decided when bonding the CEREC restoration in the prepared tooth. It could be considered as the reason to why CEREC Cad-Cam restored cavities showed high microleakage.
The mechanism for hard tissue ablation by Erbium lasers is explosive water-mediated ablation. This mechanism produces a clean tooth with no smear layer and wide opened dentinal tubules. This makes Er: YAG and Er, Cr: YSGG an ideal, efficient and versatile tool for preparing tooth. The results we achieved in this study were similar to the studies conducted in the past [13,52-63]. As there were some errors in the designing and milling of the CEREC block by CEREC Cad-Cam that led to the highest microleakage in all groups, further studies need to be conducted with improved materials and methods such as the latest ceramic composite hybrid (Enamic by Vita).
Conclusion
From this study, it is concluded that Erbium class lasers are the most convenient and versatile options in this modern field of dentistry. Although bur handpiece cannot be ignored because of its highest preparation capabilities, the drawback remained such that the use of high-speed handpiece caused the deposition of the smear layer on the surface of the prepared tooth resulting in the blockage of dentinal tubules and preventing the penetration of bonding material for retention of the composite restoration. Both Er: YAG and Er, Cr: YSGG lasers were proven to eliminate the smear layer through the water-mediated ablative process. The dentinal tubules were widely open, and it has been scientifically proven that the laser can remove the bacteria’s and their colonies from within the dentinal tubules through water-mediated ablative blasts. Hence, the surface irregularities seen in laser ablative cavities are advantageous towards the microleakage reduction and retention of filling materials compared to conventional handpiece burs.
Conflict of Interest
The authors declare that there is no conflict of interest.
Acknowledgments
The author wishes to express sincere appreciation to Professors Dr. Norbert Gutknecht PhD, and Dr. Rer Medic René Franzen, Physicist PhD, for their assistance and support in the preparation of this manuscript.
REFERENCES
- http://en.wikipedia.org/wiki/Dental_drill.
- http://www.dentalinstitute.com/Articles/PPAD/Column/Cutting%20Edge.pdf.
- https://www.encyclopedia.com/international/encyclopedias-almanacs-transcripts-and-maps/medical-practitioners-and-medicine.
- Bennion E. Antique dental instrument. Sotherby’s Publications, London, United Kingdom.
- https://kundoc.com/pdf-operative-dentistry-8bc9e27ee86c23c7f5ff4b0afe3dae6043940.html.
- https://www.sciencephoto.com/media/395887/view/archimedean-drill-19th-century.
- Peters MC, McLean ME. Minimally invasive operative care II contemporary techniques and materials: an overview. J Adhes Dent. 2001;3:17-31.
- Ericsson D, Zimmerman M, Raber H, Gotrick B, Bornstein R, Thorell J. Clinical evaluation of efficacy and safety of a new method for chemo-mechanical removal of caries: a multi-centre study. Caries Res. 1999;33:171-177.
- Walsh LJ, Perham SJ. Enamel fusion using carbon dioxide laser: a technique for sealing pits and fissure. Clin Prev Dent. 1991;13:16-20.
- http://commons.wikimedia.org/wiki/File:Diamond_burs.jpg.
- www.fda.gov.
12. Hibst R. Lasers for caries removal and tooth preparation: state of the art and future directions. J Oral Laser Appl. 2002;2:203-211. - Meister J, Franzen R, Forner K, Grebe H, Stanzel S, Lampert F, et al. Influence of the water content in dental enamel and dentin on ablation with erbium YAG and erbium YSGG lasers. J Biomed Opt. 2006;11:0340301-0340307.
- www.laserandhealth.com.
- Perhavec T, Diaci J. Comparison of Er: YAG and Er, Cr: YSGG dental lasers. J Oral Laser Appl. 2008;8:87-94.
- Diaci J. Laser profilometry for the characterization of craters produced in hard dental tissues by Er: YAG and Er, Cr: YSGG lasers. J Laser Health Acad. 2008;2:1-10.
- Perhavec T, Gorkič A, Bračun D, Diaci J. A method for rapid measurement of laser ablation rate of hard dental tissue. Optics Laser Technol. 2009;41:397-402.
- Kidd. Microleakage a review. J Dent. 1976;4:199-206.
- Bergenholtz G, Cox Cf, Loesche WJ, Syed SA. Bacterial leakage around dental restorations: Its effect on the dental pulp. J Oral Pathol. 1982;11:439-450.
- Browne RM, Tobias RS. Microbial microleakage and pulpal inflammation: a review. Endod Dent Trumatol. 1986;2:177-183.
- Rees JS, Jacobson PH. The polymerization shrinkage of composite resins. Dent Mater. 1989;5:41-44.
- Towbridge H. Model system for determining biological effects of microleakage. Oper Dent. 1987;12:164-172.
- Hilton TJ. Can modern restorative procedures and materials reliably seal cavities? In vitro Investigations. Part 1. Am J Dent. 2002;15:198-210.
- Taylor MJ, Lynch E. Microleakage. J Dent. 1992;20:3-10.
- Karagenc B, Gençoglu N, Ersoy M, Cansever G, Külekçi G. A comparison of four different microleakage tests for assessment of leakage of root canal fillings. Oral Surg Oral Med Oral Pathol. 2006;102:100-113.
- Youngson CC. A technique for three dimensional microleakage assessment using tooth sections. J Dent. 1992;20:231-234.
- Gale MS, Darvell BW, Cheung GSP. Three dimensional reconstruction of microleakage pattern using sequential grinding technique. J Dent. 1994;22:370-375.
- Lyroudia K, Pantelidou O, Mikrogeorgis G, Chatzikallinikidis C, Nikopoulos N. The use of 3D computerized reconstruction for the study of coronal microleakage. Int Endodont J. 2000;33:243-247.
- Iwami Y, Shimizu A, Hayashi M, Takeshige F, Ebisu S. Three dimensional evaluation of gap formation of cervical restorations. J Dent. 2005;33:325-333.
- http://www.cereconline.com/cerec/faqs.html.
- http://www.cereconline.com/cerec/digital-impressioning.html.
- www.cleardental.com.au/images/50686d771d70c.jpg.
- www.dentalcadcam.de/dentalshop/vita-powder-scan-spray-75ml-fl.html.
- Crim GA, Mattingly SL. Evaluation of two methods for assessing marginal leakage. J Prosthet Dent. 1981;45:160-163.
- Crim GA, Swartz ML, Phillips RW. Comparison of four thermocycling techniques. J Prosthet Dent. 1985;53:50-53.
- Hakimeh S, Vaidyanathan J, Houpt ML, Vaidyanathan TK, von Hagen S. Microleakage of compomer class V restorations: effect of load cycling, thermal cycling, and tooth shape differences. J Prosthet Dent. 2000;83:194-203.
- Litkowski LJ, McDonald NJ, Swierczewski M. A comparison of thermalcycling methods for evaluation microleakage. J Dent Res. 1989;68:207.
- Schuckar M, Geurtsen W. Proximo-cervical adaptation of class II composite restorations after thermocycling: a quantitative and qualitative study. J Oral Rehabil. 1997;24:766-775.
- Alani AH, Toh CG. Detection of microleakage around dental restorations: a review. Oper Dent. 1997;22:173-185.
- Gale MS, Darvell BW. Thermal cycling procedures for laboratory testing of dental restorations. J Dent. 1999;27:89-99.
- Shortall AC. Microleakage, marginal adaptation and composite resin restorations. Br Dent J. 1982;53:223-227.
- Rossomando KJ, Wendt SL. Thermocycling and dwell times in microleakage evaluation for bonded restorations. Dent Mater. 1995;11:47-51.
- http://www.biolase.com/products/iplus/iPlus_Brochure.pdf.
- http://www.fotona.com/en/dentistry/.
- www.cleardental.com.au/images/50686d771d70c.jpg.
- www.dentalcadcam.de/dentalshop/vita- powder-scan-spray-75ml-fl.html.
- http://www.leica-microsystems.com/products/stereo-microscopes-macroscopes/routine-manual/details/product/leica-mz6/.
- http://www.ansci.wisc.edu/facstaff/Faculty/pages/albrecht/albrecht_web/Programs/microscopy/prep.html.
- https://www.iso.org/standard/33817.html.
- Clarke GM, Cooke D. A basic course in statistics. Arnold. 1998;2:520-546.
- Cohen PR. Empirical methods for artificial intelligence. MIT Press. 1995;7:185-287.
- Martens LC. Laser assisted pediatric dentistry; review and outlook. J Oral Laser Applic. 2003;3:203-209.
- Majaron B, Sustersic D, Lukac M, Skaleric U, Funduk N. Heat diffusion and debris screening I Er: YAG laser ablation of hard biological tissues. Appl Phys B. 1998;66;1-9.
- Ivanov B, Hakimian AM, Peavy GM, Haglund RFF. Mid-infrared laser ablation of hard biocomposite material: mechanistic studies of pulse duration and Interface effects. Appl Surf Sci. 2003;209:77-84.
- Hossain M, Nakamura Y, Yamada Y, Kimura Y, Matsumoto N, Matsumoto K. Effects of Er, Cr: YSGG laser irradiation in human enamel and dentin: ablation and morphological studies. J Clin Laser Med Surg. 1999;17:155–159.
- Hossain M, Nakamura Y, Yamada Y, Murakami Y, Matsumoto K. Microleakage of composite resin restoration in cavities prepared by Er, Cr: YSGG laser irradiation and etched bur cavities in primary teeth. J Clin Pediatr Dent. 2002;26:263-268.
- Aranha AC, Turbino ML, Powell GL, Eduardo Cde P. Assessing microleakage of class V resin composite restoration after Er: YAG laser and bur preparation. Lasers Surg Med. 2005;37:172-177.
- Stock K, Hibst R, Keller U. Comparison of Er: YAG and Er: YSGG laser ablation of dental hard tissues. SPIE. 2000;3192:88-95.
- Belikov AV, Erofeev AV, Shumilin VV, Tkachuk AM. Comparative study of the 3 micron laser action on different hard tissue samples using free running pulsed Er-doped YAG, YSGG, YAP and YLF lasers. SPIE. 1993;2080:60-67.
- Perhavec T, Diaci J. Comparison of Er: YAG and Er, Cr: YSGG dental lasers. J Oral Laser Appl. 2008:8:87-94.
- Perhavec T, Gorkic A, Bracun D, Diaci J. A method for rapid measurement of laser ablation rate of hard dental tissue. Optics Laser Technol. 2009;41:397-402.
- Diaci J. Laser profilometry for the characterization of craters produced in hard dental tissues by Er: YAG and Er, Cr: YSGG Lasers. J Laser Health Acad. 2008;2008:1-9.
- Lin S, Liu Q, Peng Q, Lin M, Zhan Z, Zhang Z. Ablation threshold of Er: YAG and Er, Cr: YSGG laser in dental dentin. Sci Res Essays. 2010;5:2128-2135.
Citation: Iqbal M (2020) A Comparative Study to Evaluate the Surface Quality of Erbium Dental Lasers with Conventional Bur Preparation Followed by the Microleakage Assessment of the Composite and Cerec Cad-Cam Restored Cavities. Dentistry 10:562. doi: 10.35428/2161-1122.20.10.562
Copyright: © 2020 Iqbal M. This is an open-access article distributed under the terms of the Creative Commons Attribution License, which permits unrestricted use, distribution, and reproduction in any medium, provided the original author and source are credited.
